Valuation: Intel vs TSMC vs AMD

Recently, Intel announced the delay of its 7-nanometer integrated circuit process. Affected by the news of Intel’s delay, Intel stock moderately sold off. At the same time, Intel’s competitors AMD (Advanced Micro Devices) and Taiwan Semiconductor Manufacturing (TSMC) have seen their stock prices rise sharply. Given the recent hype in technology stocks, AMD and TSMC stocks have been very hot recently. I think Intel’s sell-off has been exaggerated, while the valuations of AMD and TSMC suggest unrealistic growth. The purpose of this article is to perform a fundamental DCF analysis of Intel and compare it with the valuations of AMD and TSMC.

Background

The narrative is that Intel’s latest chips will be delayed, their rival AMD will gain the lead by selling 7nm devices. AMD does not produce its chips. Instead, AMD signed a contract to produce its circuits with Taiwan Semiconductor Manufacturing Co (TSMC), the largest IC contract manufacturer. As another twist, Intel has stated that if they need a backup plan, they will have TSMC produce some of their chips. The market is interpreting this announcement as Intel is doomed and that AMD and TSMC will grow like crazy. This is reflected in the share price of these stocks, which is shown below. 

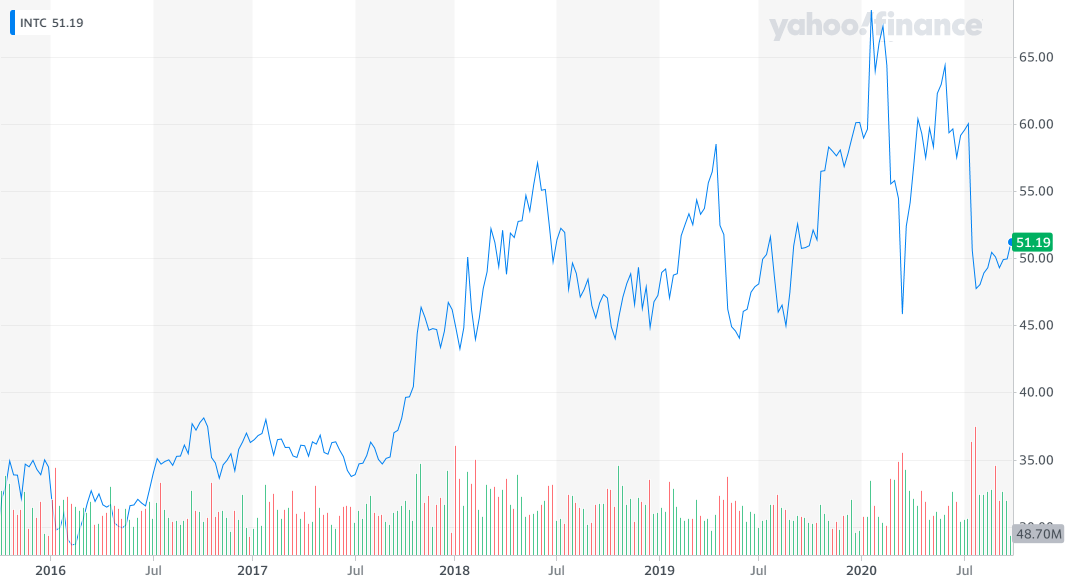
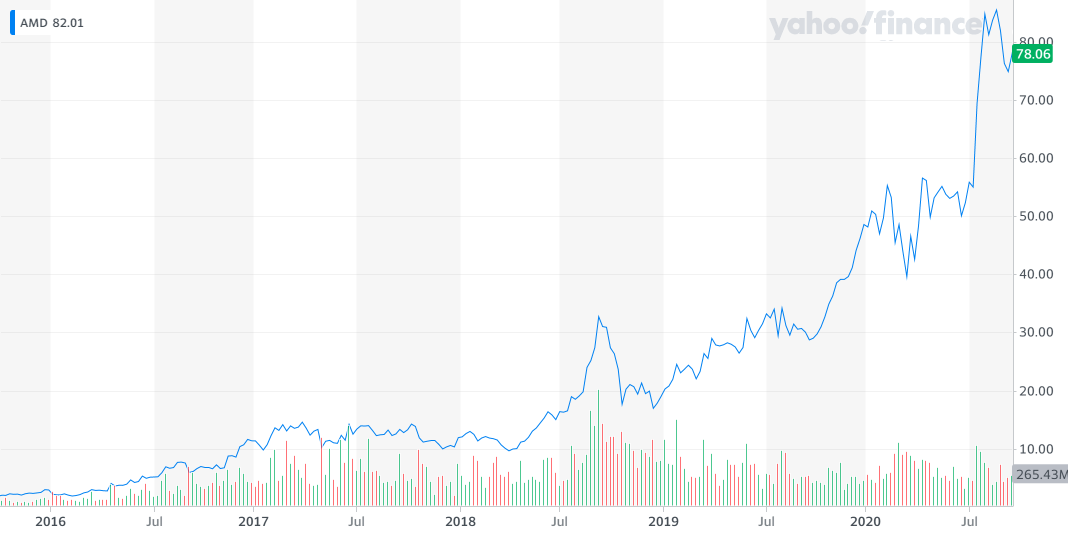
Both AMD and TSMC stock prices have gone parabolic lately. Part of this is from Intel’s news, while a lot of it is their gains are from the recent tech stock mania.

By doing a rough DCF valuation on these companies, I believe Intel is reasonably valued. As for AMD and TSMC, I believe the market is pricing in unrealistic growth. The narrative may be true, that Intel loses market share. Maybe Intel becomes the next IBM, being less relevant than its glory days. On the flip side, I believe overpaying for a stock is far riskier than scary headlines. Value investors look for times when negative news is overblown, and the stock can be bought at a discount.

Intel DCF

First, let’s estimate the value of Intel using a discounted cash flow model. Intel’s free cash flows for the last few years, plus trailing-twelve-month, are shown in the table below. I’ll use the average of these FCF figures in my model by using $15B as the input. Over the last five years, Intel has grown revenue at 7% a year. I will handicap this a bit by using a 5% growth rate for the next ten years. For the growth rate beyond year 10, I will use a value of 2%. The last input to the model is the discount rate, which I will set to 10%. These values estimate the value of Intel at $51.20 a share. Currently, Intel is trading for around $50 a share.

201720182019TTM
10.33B14.24B16.93B21.9B
Intel Free Cash Flow

Based on this analysis, Intel appears to be fairly valued. It may not be a screaming bargain, but it is trading at a reasonable business valuation. I believe the market’s narrative is exaggerating Intel’s troubles. It is quite possible that you could buy Intel, and the business produces a 10% average return. As we will see, I do not believe that is the case with AMD or TSMC.

TSMC DCF

Next, we will perform the same calculation on TSMC. The table below shows TSMC’s recent free cash flow figures. An average free cash flow value of $7.3B seems reasonable, so that will be input into the model. In the last five years, the income growth rate is 8%, so we assume that the cash flow in the next ten years can grow at this rate. The terminal growth rate and discount rate are the same as the Intel example. These DCF inputs yield an estimated value of $27.25, while TSMC currently trades around $79 a share.

201720182019TTM
8.56B8.41B5.16B5.16B
TSMC Free Cash Flow

As you can see, there is a significant discrepancy between my estimate of what TSMC’s business is worth compared to what the market thinks. Perhaps I underrated TSMC’s growth rate since the narrative is that it will gain market share on Intel. Let’s try redoing the calculation by using a 15% free cash flow growth rate instead of 8%. This produces a value of $42.80 per share. Ok, how about we try an even more optimistic growth rate of 20%. The DCF outputs a value of $59.15 per share for TSMC, still significantly below what it currently trades at.

Another technique I like using when looking at stocks is performing a reverse DCF. This is done by specifying the current cash flow, discount rate, and current stock price. Then address the growth rate instead of the business value. This can help investors understand what kind of growth the market is pricing in stocks. Through this exercise, based on TSMC’s current prices, the market estimates a ten-year growth rate of 25%.

I believe a 25% growth rate for TSMC is rather optimistic. Many companies can grow at high rates for short bursts, but it is difficult to sustain greater than 20% growth for ten years. It is possible TSMC could pull it off, but I assign a pretty low probability to this.

AMD DCF

Finally, in our Intel 3-way show off, we will calculate the value of AMD. The recent cash flows are shown below, and we can see 2017 and 2018 cash flows are negative. The 2019 FCF figure is slightly positive, and the TTM number is the highest in this series of data. To be generous, we use the round number of $600M. In this example, I will use a 7% growth rate, which is why AMD’s revenue has been growing in the last five years. With these inputs, the DCF produces a whopping $9.70 for AMD’s shares…AMD currently trades at $78.

201720182019TTM
-101M-129M276M611M
AMD Free Cash Flow

To give AMD the benefit of the doubt, let’s recalculate its value using higher growth rates. Using a 15% growth rate produces a value of $15.95, while a 20% growth rate yields $21.90 a share. Both of these are well below what AMD currently trades at.

Using the reverse DCF, we can see how much growth the market is pricing in. This technique shows that AMD would have to grow at 40% per year for ten years straight to justify its value. This growth rate is completely unrealistic. Sure, the stock price of AMD has skyrocketed lately, but the business hardly makes any money. The price of AMD makes no sense when looking at it as a business. Instead, the market is valuing AMD based on its narratives, making increased profits from AI, self-driving cars, cryptocurrency mining, and, most recently, gaining market share from Intel. These could all come true, but an investor must pay a reasonable price for growth.

Conclusion

As a value investor, I try to find situations where the market hates a stock or industry. Usually, these narratives are exaggerated, which creates opportunities. The market has also exaggerated potential growth, which has resulted in stock transactions that are much higher than actual growth rates. With this post, I tried to show that the market is pessimistic towards Intel. Still, it is trading at a decent business valuation. Intel’s competitors, however, are trading at values that imply unrealistic growth. AMD and TSMC may continue to do well in the short term, but valuations matter over the long term.

For more value investing content check out:

Q2 2020 Portfolio Update

Intro to DCF Analysis Part 1

Intro to DCF Analysis Part 2

The Many Flavors of Value Investing

Q3 2020 Portfolio Update

This post contains affiliate links. If you use these links to buy something I may earn a commission. Thanks for your support.

Performance Overview

For Q3 2020, the portfolio is up 4.49% and is up 9% year to date. The Q3 starting balance was $89,241.80, and finished the quarter at $96,383.61. Contributions to the portfolio during the quarter amount to $3,135. 

No stocks were sold during this quarter, but nine new positions were added. The nine companies I have bought are Barrett Business Services (BBSI), Hexcel (HXL), Friedman Industries (FRD), George Risk Industries (RSKIA), Paul Mueller Co. (MUEL), Richardson Electronics (RELL), Surge Components (SPRS), FutureFuel (FF), and FirstEnergy (FE).

FirstEnergy is a sizable position, while the rest of the purchases were smaller allocations. FRD and RELL were net-nets (trading below net current asset value) at purchase. The rest of the smaller positions make up my foray into deep value investing, meaning they trade at very low EV/EBIT ratios. Many of these stocks are microcaps, meaning their market capitalization is below $300 million.

The current allocation of the portfolio is shown in the chart below. Currently, the portfolio  consists of discretionary value stocks, oil tankers, deep value, 401k stocks, precious metals, and cash. It can be seen that 69.8% of the portfolio is in stocks, while 30.2% is in cash and safe haven assets. I would prefer to deploy more of the cash to undervalued stocks, but I am remaining cautious despite the market surging during the third quarter.

During the quarter I received $318.08 total in dividends, which is broken down in the table below.

TickerQuarterly Dividend 
FF8.28
BBSI10.50
FRO81.50
STNG6.80
DHT103.20
EMR42.50
COF5.50
SPG59.80
Total318.08

My Thoughts

This quarter has been pretty drama free for my portfolio. The pandemic and economic difficulties have appeared to mellow out…but I wouldn’t be surprised if there is more trouble on the horizon. Despite my cautiousness, I did some buying this quarter. My goal of building out about 20 deep value positions started this quarter, with my purchase of eight companies. For the foreseeable future, I want to move towards an allocation of 70% stocks, 30% safe haven assets. I believe this will allow me to put some cash to work, while also having some ammo if the market corrects again. 

As for the market, it still appears irrational. Everyone and their plumber is making easy money in the market right now. Everything seems easy when the market keeps going up, but let’s not forget everyone freaking out in March. I strongly believe there is a difference between gambling speculation and investing (ok oil tankers are a speculation, but at least there’s a reasonable thesis behind it). I’m here trying to build wealth, not make quick gains. 

Also, the election is coming up, which I’m sure will be completely drama free…but if you think your portfolio is going to tank because the other guy won, well, you’re doing it wrong. As Buffett has said, don’t bet against America. Our businesses and country have been the place to be for 200 years. And if you’re that worried about a Great Depression 2.0, then you can always invest in a resiliant multi-asset portfolio.

Discretionary Summary

Discretionary value is the label I’m giving to the positions that are fairly large (~5% of the portfolio) I believe are undervalued and may have the following characteristics: quality business, competitive advantage, misunderstood by the market, or a good company in a heavily sold off industry. The current discretionary value stocks I own consist of Capital One Financial (COF), Emerson Electric (EMR), Simon Property Group (SPG), and FirstEnergy (FE). The table below shows the cost basis, current value, and gains/losses for these positions.

Avg PriceCost BasisCurrent ValueCurrent Gain (Loss)
COF63.253,478.753,952.313.61%
EMR41.003,485.005373.4559.93%
SPG74.503,427.002975.28-13.18%
FE28.003,500.003,588.752.54%

FirstEnergy

FirstEnergy (FE) is an Ohio based electric utility company. FE services Ohio, Pennsylvania, West Virginia, Virginia, Maryland, New York and New Jersey. The reason FE is cheap is because it has been caught up in a bribery case involving Ohio Bill HB 6. FirstEnergy contributed to a political action committee to support this bill. This piece of legislation deals with the bankruptcy of FirstEnergy’s previously owned nuclear power plants.

These nuclear plants were spun off from FE a few years ago, into a new company called First Energy Solutions (now named Energy Harbor). FirstEnergy’s management separated from spin off three years before the HB 6 bill was proposed, and FirstEnergy Solutions went bankrupt a year before HB 6. FE management claims they did nothing wrong. Based on the info so far, it appears FE washed their hands of the nuclear plants years before the bill, and the legislation does not benefit FE that much. 

Part of my strategy is to find stocks that are heavily sold off from negative news. These situations can create opportunities because oftentimes the market becomes overly pessimistic on the stock. I believe FE has a good chance of coming away clean from these allegations, but I will monitor the situation in the coming quarters. 

This holding could either be a “value flip” or a longer term, bond substitute that will protect against inflation. Once this negative news gets settled, it is possible FirstEnergy will revert back to its pre-selloff price. I purchased FE at $28 at share, and it was trading around $45 a share before the negative headlines. While I wait for this reversion, I will get a safe 5.5% dividend yield and hopefully enjoy the low volatility typically associated with utilities. 

Tanker Stocks

Tankers have continued to be disappointing, despite their great profitability this year. I probably bought these stocks at the top, which is frustrating, but I’ll continue to push through the pain. Frontline and DHT have been rewarding shareholders with juicy dividends, so that somewhat alleviates the sting. The Twitter account @calvinfroedge has been a great resource for oil tanker investors, and he nicely sums up tankers so far this year: 

Avg PriceCost BasisCurrent ValueCurrent Gain (Loss)
DHT8.171,755.901,109.40-36.82%
FRO10.661,738.291,059.50-39.05%
STNG26.631,742.67752.76-56.8%
TNK23.861,765.88802.16-54.57%

Deep Value

Deep value is a sub-strategy I’m employing in my portfolio. This a quantitative strategy that buys a basket of statistically cheap stocks. The metric I use is EV/EBIT, based on the wonderful book The Acquirers Multiple. Historically, this strategy has provided excellent returns, although it has not kept up with the S&P 500 the past few years. Additionally, I am making an effort to apply this strategy to microcap companies. Microcaps are classified as having a market capitalization between $50M-300M. These small companies are more volatile, but have the potential for attractive returns.

My position sizing is smaller than the discretionary side of my portfolio because I want to own a basket of about 20 stocks. Since this is a quantitative strategy, I do not spend much time analyzing these businesses. The main idea is that these companies are trading at very cheap valuations, and the winners will (hopefully) outnumber the losers. This quarter I added eight positions, which can be seen in the table.

Avg PriceCost BasisCurrent ValueCurrent Gain (Loss)
BBSI50.501,767.501835.403.84%
FF13.001794.001569.06-12.54%
FRD5.101800.101643.9513.74%
HXL36.801803.201643.95-8.83%
MUEL26.001768.001836.003.85%
RELL4.451802.251688.85-6.29%
RSKIA8.251740.752557.7029.70%
SPRS1.311819.301869.752.77%

401k and Precious Metals

My 401k is through my current employer and actively receives contributions. The 401k consists of a Blackrock Target Date Fund (which is no longer being funded), and the Oakmark Fund. The Oakmark Fund is a large cap value fund. Since I am actively contributing to my 401k, it will naturally have a growing influence on my portfolio. 

I also have a decent allocation to precious metals that are used as a bond substitute, recession and inflation hedge. The table below shows the YTD performance for the precious metals and 401k, which includes the effects of contributions.

12/31/199/30/20YTD Gain (Loss)YTD Contribution
Precious Metals$7,861.00$9,964.0026.75%
401k$10,962.24$23,687.3311.36%$10,863.00

Interesting Articles

If you think this post is boring, then  check these articles I read this quarter.

Monopolies are Distorting the Market

Buying Stocks Trading Above 10x Sales A Good Idea?

Books I’m Reading

A few weeks ago I went to the local used book store for the first time since the pandemic and found a copy of the classic Buffettology. This book contains a lot of info that Buffett die hards will have seen elsewhere. However, I think it is a great book for a newer investor to gain the right mindset about investing. One of the main points is thinking about a stock like owning a piece of a business, which is something I totally agree with. The book presents an interesting business valuation method. A gripe I have is that I think this method suffers from some hindsight bias, so I’m not sure how practical it is to use. 

Another book I read this quarter was Capital Allocation: The Financials of a New England Textile Mill 1955 – 1985. This book is the history of Berkshire Hathaway in the decade prior to Buffett taking control, and his capital allocation decisions up until the mid 80’s. Capital Allocation tells the story of how a struggling textile mill became one of the strongest companies in this country. My favorite part of this book is the deep dive into the financials of Berkshire and its early investments that I have not seen elsewhere. I loved nerding out over all of the financial statement snippets. Capital Allocation has a new place in my top 5 investing books. 

For more value investing fundamentals check out:

Q2 2020 Portfolio Update

Intro to DCF Analysis Part 1

Intro to DCF Analysis Part 2

The Many Flavors of Value Investing