What Drew Me to Railroads
Lately I have been wanting to analyze quality companies so that when they become cheap during the market sell off, I can make a quick buy decision. Railroads were at the top of my list of a business that I wanted to do a deep dive on. I decided to analyze the financials of Union Pacific Railroad (UNP) because they are the largest railroad in the US.
There are several reasons why I’m interested in railroads. First, they’ve been around for 200 years, so they haven’t gone obsolete yet. Railroads enjoy network effects and barriers to entry. It would be nearly impossible to build all new rail lines. Locomotives are also the most efficient way to transport goods across land. Because of these factors, I believe railroads have one of the strongest moats out there.
Qualitative factors aren’t the only reasons to invest in a company, you need to take a look at their financials. When something jumps out at me in UNPs financials, I tried to dig deeper to find an explanation. I documented my train of thought in this post, basically asking questions and trying to draw conclusions. Also, I tried to include a good amount of charts to help visualize trends in the financial statements. In the end, I feel like I have a much clearer understanding of Union Pacific’s business.
Why is FCF CAGR Higher Than Revenue?
One of the first things I take a look at when analyzing a company is the growth rate of revenue, operating income, operating cash flow, FCF, etc. The chart below shows UNP’s 10 year revenue, cash flow from operations, and free cash flow. Over the past ten years, revenue has grown at a CAGR of 1.6%. Revenue grew at a steady pace from 2010 to 2014. At first I wondered if it was due to bouncing back from the 2008 recession. However, revenue was $18B in 2008, fell to $13.3B in 2009, then was back to $17B in 2010.
The revenue growth is probably due to the shale energy boom that was going on back then. A decent chunk of Union Pacific’s revenues comes from transporting frac sand, and the resulting crude, natural gas, and finished products. When oil prices plummeted in 2015, domestic oil production was curtailed. The shale oil bust helps explain UNP’s decline in revenues since 2014.

Despite the low revenue growth, operating cash flow has grown by 3.8% and FCF has grown by 7.9%. The fact that these cash flows have outpaced revenue growth warrants some more investigation. Over a long time horizon, it doesn’t make economic sense that profits would grow faster than the revenue the business is bringing in. Union Pacific’s growth of cash flow from operations can be explained by the improvement of the operating ratio, which I will touch on in a bit.
Since the free cash flow is the operating cash flow, minus capex, it will grow in tandem with the operating cash flow. Additionally, since the free cash flow has outpaced operating cash flow, this implies that capex has proportionally decreased over the course of the past ten years. Looking at the cash flow statement, capex has been about flat for the past 5 years.

Operating Ratio
One of the key metrics used to judge the performance of a railroad is its operating ratio. The operating ratio is simply the operating expenses divided by the revenue. A lower ratio implies the railroad is more efficient, so it’s a never ending quest to lower the ratio.
The chart below shows the operating ratio from 2006-2020. The 80% operating ratio in 2006 seems pretty inefficient compared to the 60% of recent years. This large improvement in efficiency is a large factor of how Union Pacific’s cash flow from operations has grown so fast. Revenue has grown at a mediocre rate, but expenses have dramatically fallen.
Honing in on the next chart, we see individually UNP’s revenue and expenses. Something I noticed was that revenue started growing faster than expenses around 2009 until 2014. Since then revenue and expenses have more or less moved in tandem.
As someone who is potentially interested in owning railroads, I would hope that the operating ratio continues to decline. Union Pacific has declared that their goal is to reach an unheard of 55% ratio. This is a worthy goal, and there are probably efficiencies to be gained from automation and technology. UNP began the Precision Railroading concept in 2018, which should continue to reduce expenses. However, an investor should be cognizant of the possibility that there are diminishing returns in efficiency, or operating income deteriorates somehow (wages, fuel prices increase, more capex?). As an amateur railroad analyst, I have no idea how likely it would be that expenses increase. A stagnant, or increasing operating ratio would impact other areas of UNP’s business, which I will touch on later.


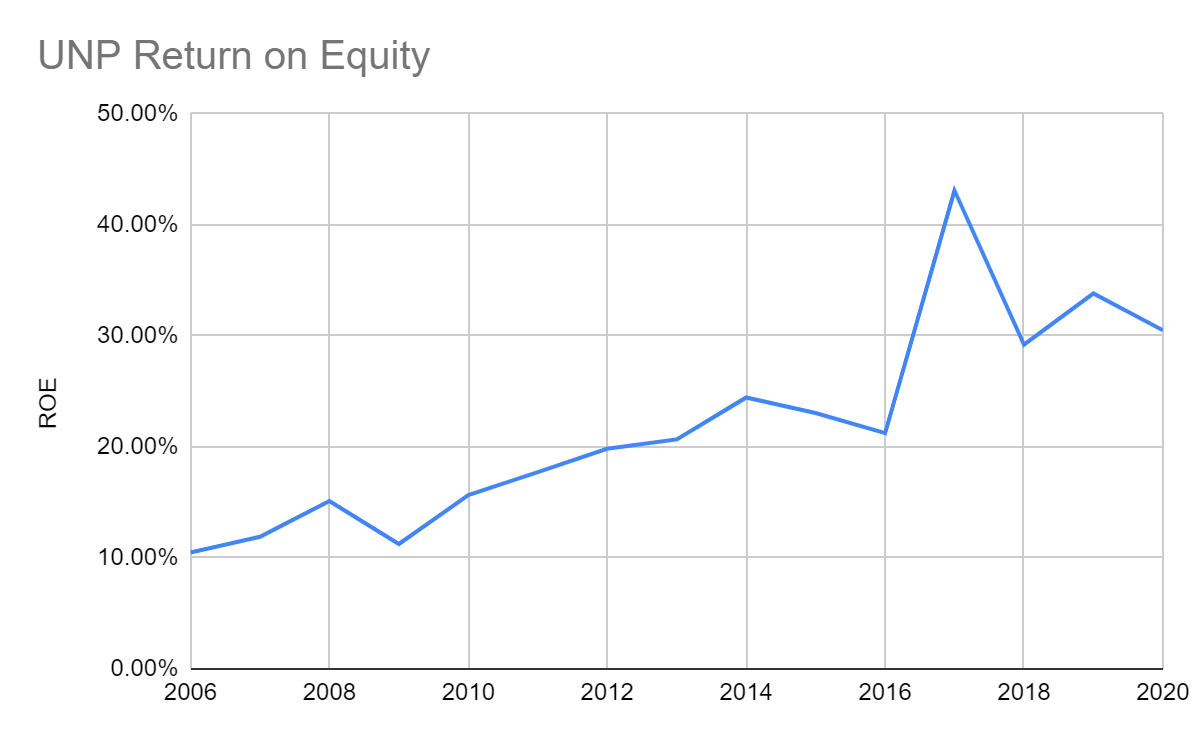
Return on Equity
Here I want to briefly look at UNP’s return on equity. In the chart you can see that ROE steadily went from around 10% in 2006 to about 20% in 2016. Then in 2017, Union Pacific’s ROE spiked to 43%, then fell closer to 30% the past couple of years. These large jumps are due to the railroads change in equity due to a large increase in net income in 2017. The large net income increase was due to the tax cuts. UNP paid about $3 billion in taxes for 2016, but was refunded about $3 billion in 2017. In general, UNP’s upward trend in ROE is from increasing net income, as well as decreasing shareholder equity (which I’ll touch on in a minute).
Why Has D/E Increased Lately?
A company’s debt-to-equity ratio is one of the key metrics I look at to gauge the strength of the balance sheet. Typically I would want a company to have a D/E below 1.0, unless they have very stable earnings. A high debt-to-equity value means the business has a large debt burden, which could mortally wound them during a rough patch in the economy. Seeing the spike in the D/E for UNP required me to dig in further.
UNP Debt
From 2005 to 2014, UNP’s D/E has been around a safe 0.5. More recently, the debt-to-equity ratio has ramped up, ending 2020 at 1.5. These values are fairly high, and the sharp trend upward is a bit concerning. Starting in 2012, UNP has been ramping up debt issuance. Over the last 5 years, they have issued an average of $2.8 billion in debt per year.


UNP Equity
On the equity side, we have seen earlier that shareholders equity has steadily decreased. When the denominator (debt) is increasing and the numerator (equity) is decreasing, it makes sense that the D/E has tripled. Digging into the equity a little more, the two key line items are retained earnings and treasury stock. Retained earnings are steadily increasing, going from $17.15B in 2010 to $51.3B in 2020. This is good because it means the company is consistently profitable.
Treasury stock is the placeholder value for the cumulative dollar amount of share the company has bought back. These share buybacks are considered negative equity, so they count against the shareholder equity value. Treasury stock has gone from -$4B in 2010, to -$40.4B in 2020. The growth in treasury stock, aka their share buybacks, is what is greatly decreasing Union Pacific’s equity. So the key takeaway here is the UNP is increasing debt, while also reducing their equity through share buybacks. This is causing the dramatic rise in D/E. The reduction in equity also explains the recent elevated ROE.
Shareholder Return
As we saw by analyzing the ROE and D/E, UNP is reducing their equity through share buybacks. This is usually beneficial to shareholders, so we can calculate shareholder return. Shareholder return is calculated by adding the dividends paid and the dollar amount of share buybacks. You can then convert this to a per share basis, and figure out your yield based on the price paid for the stock.
These values can be found on the cash flow statement. Here we find that in 2020, UNP paid out $2.63B in dividends while spending $3.71B buying back shares, for a total shareholder return of $6.34B. As a note in 2020 UNP reduced their buybacks by about $1B compared to the previous year. On a per share basis, shareholder return was $9.34 a share. Looking at the past 5 years, we can round a bit and say that UNP has spent $2B in dividends and $5B in buying back shares.
Analyzing the cash flow statement further, we can see that the 2020 free-cash flow per share is $8.26. This is an interesting observation because it means UNP is returning more cash to shareholders, than what the operating business is generating. How is this done? UNP is able to do this by constantly issuing debt. Luckily this is cheap debt. However it would seem reasonable that UNP can not return more cash to shareholders than the business produces forever.

Debt Limits
How long can Union Pacific continue to reward shareholders by issuing debt? Well that is tough to answer, but probably comes down to the risk tolerance of management and the shareholders, UNP’s debt covenants, interest rate levels, and the company’s earnings power. As I mentioned earlier, typically I prefer a D/E ratio below 1.0, however the management may feel comfortable at a higher level since interest rates are low. If that is the case, I would have to decide if I think the stock could weather a recession with that debt load.
I did a little digging into Union Pacific’s debt covenants. At one point in their 10-K, UNP mentions they can not surpass a Debt/EBITDA ratio of 3.5. In their most recent earnings presentation, UNP stated their Debt/EBITDA ratio increased from 2.5 in 2019 to 2.9 in 2020. I’m not sure what a reasonable Debt/EBITDA ratio is for a railroad, but it seems 3.5 is getting into the danger zone. We already observed that debt has been increasing at about $3-5B a year. On the EBITDA side, it has not really increased in the last several years. If this trend continues, then it seems reasonable that UNP will hit their Debt/EBITDA limit of 3.5 within the next few years.
Union Pacific’s Future Shareholder Return
Going forward, it looks like Union Pacific has to increase their earning power to keep the share buyback train going, or eventually slow down the debt issuance and pay down their current debts. The increasing earnings power plan could be a realistic outcome. That is where our friend the operating ratio comes back into play. If UNP can go from an operating ratio of 60% down to 55%, that will provide more EBITDA to keep them under their debt covenant. My naive guess is that there are plenty of efficiency gains to be had from technology and automation. The spoiler would be if expenses increased for some reason, such as fuel cost or labor cost.
If Union Pacific’s earnings power does not materially increase, then eventually they will hit a point where they need to deleverage. The least painful scenario would be to not increase share buybacks/shareholder return every year. Then as earnings grow, the excess can be used to pay down the debt. The more painful situation would be UNP reducing its shareholder return in order to reduce its debt level. If investors are used to getting a relatively high return through dividends and buybacks, they will most likely react negatively if those are dialed back.
What Management is Saying
In Union Pacific’s Q3 earnings call, the management indicated they wanted to reduce debt by $800M in Q4 2020. Looking at their Q4 cash flow statement, $1.22B of debt was paid down in the fourth quarter. Management mentioned in their Q4 earnings call that they would dial back up their share buy backs in 2021 since they let their foot off the gas in 2020. It seems to me like there is some mixed messaging from the management about recently wanting to pay down debt, while at the same time wanting to ramp up buybacks in 2021.
Wrapping Things Up
After digging into Union Pacific’s financials, it leaves me a bit torn. Qualitatively, UNP is a strong company with a wide moat. Railroads provide efficient transportation, and it is nearly impossible to build competing networks. However, to me it seems like this quality operating business is wrapped in a layer of financial engineering. UNP is able to take out cheap debt, then pay more in dividends and buybacks than the cash the business generates. This seems to be a common occurrence with blue-chip companies in this era of cheap debt.
This strategy has worked out very well for the last 5+ years. I wish I would have bought some stock back then. I am worried that the party has to end eventually. Maybe UNP has a few years ahead before they have to reel back the debt. In the meantime, the stock price could continue to perform very well. However, if you’re looking to buy UNP and hold indefinitely, you may have to endure a little rough patch whenever they deleverage. I wanted to believe in Union Pacific, but I think I’ll watch on the sidelines for a bit to see how things play out.
For more value investing content check out:
How Berkshire Acquired National Indemnity