Intel (INTC) has been an out of favor stock for over a year now. The company’s share price had a recent peak in April 2021 at $68 and is now trading around $27. This is quite the move for a large cap stock, let alone one of the largest semiconductor companies in the world. Intel designs and manufactures CPUs and other integrated circuits for PCs, data center, AI, and autonomous vehicles.
One of the main reasons Intel has sold off is due to their inability to manufacture the cutting edge transistors. This has led to their competitor AMD to gain market share since they utilize Taiwan Semiconductor to manufacture their chips. Additionally, demand for semiconductors have recently softened, which has led to most semiconductor stocks to face drawdowns. Given all this negative sentiment around Intel, I decided to perform a rough valuation to see if it is a candidate for my portfolio.
The valuation approach I will use is a simplified “earnings power” valuation from Bruce Greendwald’s valuation book. The first step is to figure out a reasonable steady state revenue. In 2021, INTC did $79B in revenue, which is an all time high. However this year Intel has lowered their guidance, estimating revenue coming in around $65B. Using this year’s guidance, plus the last four years of revenue, Intel’s average revenue comes to $73B, which I will use for this analysis.
Next is operating margins. Over the past 10 years, Intel operating margins have hovered between 33% and 25%. For this analysis I’ll use 30% as a steady state operating margin. This produces $21.9B in operating earnings based on my $73B revenue figure.
Greenwald’s earnings power valuation uses an after tax earnings. Philips typically pays an effective tax rate of around 20%. This tax rate applied to the $21.9B in operating earnings produces an after tax earnings of $17.52B.
The next step is to capitalize the after tax earnings with a reasonable cost of capital to arrive at the estimated enterprise value. Looking at historical P/E ratios, INTC has varied between 18 and it’s current value of 6. Seeing that Intel is a large cap stock with strong earnings, but still rough around the edges, I think a 7% cost of capital is reasonable.
By dividing the cost of capital by the post-tax earnings, we get the enterprise value of the company. Capitalizing the $17.52B in earnings by 7% produces an enterprise value of $250.3B. INTCs current enterprise value is around $120B. From these rough calculations, it appears there is a margin of safety in Intel’s shares.
Since Intel looks promising, I’ll go ahead and calculate the estimated fair value of its shares. To go from enterprise value to equity value, first the cash balance of $28.4B is added back. Next, the short and long term debts are subtracted, which are currently $4.6B and $33.5B respectively. This produces an estimated equity value of $240.6B, and dividing by 4.09M shares outstanding produces a share price of $58.80.
Since Intel definitely looks cheap on paper, I want to continue to do more due diligence. One thing that is concerning is Intel’s inability to produce the cutting edge transistors, thus losing market share. I would like to study the issue more and see if Intel has a chance of regaining superiority in CPUs. Additionally, I’ve heard Intel is slated to spend a large amount of money on capital expenditures. I would be interested to know what all that money is going towards, and whether it will produce much growth for the company. Intel definitely has some challenges ahead, but the stock price does seem compelling as long as the fundamentals do not deteriorate significantly in the future.
In this post, I want to do a rough valuation of Koninklijke Philips (the ADR ticker is PHG). Philips provides healthcare imaging solutions, medical records solutions, respirators and other medical devices, as well as personal care devices such as electric toothbrushes and shavers. The company’s stock price hit a high around $61 in April 2021, and then proceeded to slide down ever since to the current price of around $18. It seems that a reason for this decline is due to a recall of respirators. I usually like to buy out of favor stocks due to some scandal or other temporary ailment, so PHG seemed right up my alley.
I recently read Bruce Greenwald’s Valuation book, and have been applying his different valuation approaches to the companies I am interested in. Here I will do a simplified “earnings power” valuation from the book. The first step is to figure out a reasonable revenue estimate going forward. In 2021, PHG did $19.5B in revenue, which is quite a bit down from the 2020 print of $23.8B. Looking at the past several years of revenue, Philips has not grown much, so a reasonable revenue estimate I’m using is $22B a year.
Next is operating margins. Over the past 10 years, Philips has had operating margins as low as 2.3% and as high as 9.5%. Usually margins are around 8% but there are a few bad years. For this analysis I’ll use 7% as a steady state operating margin. This produces $1,540M in operating earnings based on my $22B revenue figure.
Greenwald’s earnings power valuation uses an after tax earnings. Philips typically pays an effective tax rate of around 30%. This tax rate applied to the $1,540M in operating earnings produces an after tax earnings of $1,080M.
The next step is to capitalize the after tax earnings with a reasonable cost of capital to arrive at the estimated enterprise value. Looking at PHGs bond yields shows an average interest rate of around 6%. Another data point I use is to look at historical P/E ratios. Here, some of the average annual P/E ratios are very high, mainly due to low earnings that year and I guess the stock price did not decline much. Even with removing these outliers, the historical P/E has varied between 17 and 35, with an average around 20. Since the 6% cost of debt is higher than the historical earnings yield, I’ll stick with the more conservative rate of 6% (even though I feel like this value seems low).
By dividing the cost of capital by the post-tax earnings, we get the enterprise value of the company. Capitalizing the $1,080M in earnings by 6% produces an enterprise value of $18B. PHGs current enterprise value is $23B…so clearly the stock is still overpriced. Unfortunately, even though Philips has had a large drawdown, I am not seeing any margin of safety based on reasonable assumptions on what the business can produce. Therefore, Philips is a pass, but at least it provided a good valuation exercise.
For Q2 2022, the portfolio was down 9.15%, and down 13.66% YTD. The Q2 starting balance was $168,049.53, and finished the quarter at $162,469.10. Contributions to the portfolio during the quarter amounted to $14,696.
This quarter I want to try something new by breaking out the results of just the individual stocks that I own. The performance of just the individual stocks will certainly have more volatility than the overall multi-asset portfolio, which can be a benefit or at times a hindrance. I may phase out of reporting my full multi-asset portfolio to just focus on the individual stocks. However, I have not made up my mind on this.
The Q2 starting balance was $76,209.80, with an ending balance of $71,930.35. For the return calculation, I am considering stocks sold during the month as negative cash flow (like a distribution), and purchasing a stock is cash flow positive (money coming in), dividends are treated as distributions as well. Therefore the net cash flow for Q2 was $6,005. Putting all of this together means the portfolio was down 13.3% for Q2, and is down 14.2% YTD.
Three new stocks were bought this quarter: Williams-Sonoma (WSM), Omnicom Group (OMC), and BASF (BASFY). I added to my position in Warner Bros Discovery by buying 50 more shares. Stocks that were sold this quarter include Quidel (QDEL), B2Gold (BTG), Madison Square Garden Entertainment (MSGE), and Biogen (BIIB). The rolling over of tail hedge put options continued.
The current allocation of the portfolio is shown in the chart below. Currently, the portfolio consists of discretionary value stocks, oil tankers, deep value, 401k stocks, precious metals, and cash. It can be seen that 81.4% of the portfolio is in stocks, while 18.6% is in cash and safe haven assets.
During the quarter I received $486.53 total in dividends, which is broken down in the table below.
Ticker
Quarterly Dividend
FE
48.75
BTI
129.28
GTN
10.80
STNG
6.80
BCC
114.1
DHT
4.30
ITIC
5.52
EMR
43.78
COF
33.00
SPG
75.90
KOP
9.40
HXL
4.90
Total
486.53
Discretionary Summary
Discretionary value is the label I’m giving to the positions that are fairly large (~5% of the portfolio) I believe are undervalued and may have the following characteristics: quality business, competitive advantage, misunderstood by the market, or a good company in a heavily sold off industry. The current discretionary value stocks I own consist of Capital One Financial (COF), Emerson Electric (EMR), Simon Property Group (SPG), FirstEnergy (FE), British American Tobacco (BTI), Qurate Retail (QRTEA), and Warner Bros Discovery (WBD). The table below shows the cost basis, current value, and gains/losses for these positions.
During the second quarter, Discovery Inc. finalized their merger with Warner Media, forming Warner Bros Discovery. I think WBD can use the cash generated by the linear TV advertising to transition into one of the top streaming platforms.
Avg Price
Cost Basis
Current Value
Current Gain (Loss)
COF
63.25
3,478.75
5,730.45
64.73%
EMR
41
3,485.00
6,760.90
94.00%
SPG
74.5
3,427.00
4,366.32
27.41%
FE
28
3,500.00
4,798.75
37.11%
BTI
37.45
7,114.91
8,152.90
14.59%
QRTEA
7.6
5,700.00
2,152.50
(62.24%)
WBD
22.53
4,957.00
2,952.40
(40.44%)
Deep Value
Deep value is a sub-strategy I’m employing in my portfolio. This is a quantitative strategy that buys a basket of statistically cheap stocks. The metric I use is EV/EBIT, based on the wonderful book The Acquirers Multiple. Historically, this strategy has provided excellent returns, although it has not kept up with the S&P 500 the past few years. Additionally, I am making an effort to apply this strategy to microcap companies. Microcaps are classified as having a market capitalization between $50M-300M. These small companies are more volatile, but have the potential for attractive returns.
My position sizing is smaller than the discretionary side of my portfolio because I want to own a basket of about 20 stocks. Since this is a quantitative strategy, I do not spend much time analyzing these businesses. The main idea is that these companies are trading at very cheap valuations, and the winners will (hopefully) outnumber the losers.
The new additions to this part of the portfolio are Williams-Sonoma, Omnicom Group, and BASF.
Avg Price
Cost Basis
Current Value
Current Gain (Loss)
BCC
55.00
3,025.00
3,271.95
8.16%
GTN
23.00
3,105.00
2,280.15
(26.57%)
HXL
36.80
1,803.20
2,563.19
42.15%
ITIC
164.54
1,974.48
1,882.68
(4.65)
KOP
31.47
2,958.18
2,128.16
(28.06%)
MHO
60.00
2,520.00
1,665.72
(33.90%)
SENEA
50.00
3,000
3,332.40
11.08%
WSM
115.00
5,175.00
4,992.75
(3.52%)
OMC
65.86
4,610.37
4,452.70
(3.42%)
BASFY
11.54
4,269.80
4033
(5.55%)
Four of the deep value positions were sold this quarter due to the one year holding period. The table below summarizes the realized gains and losses. In this case, they are all losses. Obviously this is not preferred, but I do not think this batch of losers is indicative of a flawed strategy.
Cost Basis
Sale Proceeds
Realized Gain (Loss)
BTG
2,499.00
2,379.92
(4.8%)
BIIB
2,475.00
1,937.77
(21.7%)
MSGE
2,000.00
1,698.46
(15.1%)
QDEL
2,520.00
2,414.97
(4.2%)
Tanker Stocks
The tankers have seen a recovery lately, with Scorpio Tankers finally showing a gain.
Avg Price
Cost Basis
Current Value
Current Gain (Loss)
DHT
8.17
1,755.90
1,317.95
(24.94%)
FRO
10.66
1,738.29
1,444.18
(16.92%)
STNG
26.63
1,742.67
2,346.68
34.66%
TNK
23.86
1,765.88
1,304.62
(26.12%)
401k and Precious Metals
My 401k is through my current employer and actively receives contributions. The 401k consists of a Blackrock Target Date Fund (which is no longer being funded), and the Oakmark Fund. The Oakmark Fund is a large cap value fund. Since I am actively contributing to my 401k, it will naturally have a growing influence on my portfolio.
I also have a decent allocation to precious metals that are used as a bond substitute, recession and inflation hedge. The table below shows the YTD performance for the precious metals and 401k, which includes the effects of contributions.
12/31/21
06/31/22
YTD Gain (Loss)
YTD Contributions
Precious Metals
12,854.19
12,019.64
5.96%
0
401k
60,578.76
63,924.8
(19.62%)
3,696.00
Tail Hedging
This quarter I continued a tail hedging strategy that I have used in the past. The strategy involves buying 30% out of the money SPY put options that expire in a couple of months. Each month options are sold and a new set is bought. This quarter, the options have had a cost of $1,582.70, with proceeds of $891.81, leaving a net cost of $690.89.
For Q1 2022, the portfolio was down 2.63%. The Q1 starting balance was $159,295.45, and finished the quarter at $171,035.25. Contributions to the portfolio during the quarter amounted to $16,087.
No stocks were bought or sold during the quarter. However, the rolling over of tail hedge put options continued.
The current allocation of the portfolio is shown in the chart below. Currently, the portfolio consists of discretionary value stocks, oil tankers, deep value, 401k stocks, precious metals, and cash. It can be seen that 84% of the portfolio is in stocks, while 16% is in cash and safe haven assets.
During the quarter I received $393.172 total in dividends, which is broken down in the table below.
Ticker
Quarterly Dividend
FE
48.75
BTI
138.68
GTN
10.80
BTG
19.04
STNG
6.80
BCC
6.60
DHT
4.30
ITIC
5.52
EMR
43.78
COF
33.00
SPG
75.90
Total
393.17
Discretionary Summary
Discretionary value is the label I’m giving to the positions that are fairly large (~5% of the portfolio) I believe are undervalued and may have the following characteristics: quality business, competitive advantage, misunderstood by the market, or a good company in a heavily sold off industry. The current discretionary value stocks I own consist of Capital One Financial (COF), Emerson Electric (EMR), Simon Property Group (SPG), FirstEnergy (FE), British American Tobacco (BTI), Qurate Retail (QRTEA), and Discovery Inc. (DISCK). The table below shows the cost basis, current value, and gains/losses for these positions.
Avg Price
Cost Basis
Current Value
Current Gain (Loss)
COF
63.25
3,478.75
7,220.95
107.57%
EMR
41.00
3,485.00
8,334.25
139.15%
SPG
74.50
3,427.00
6,051.76
76.59%
FE
28.00
3,500.00
5,732.50
63.79%
BTI
37.45
7,114.91
8,010.40
12.59%
QRTEA
7.60
5,700.00
3,570.00
(37.37%)
DISCK
24.50
4,165.00
4,244.90
1.92%
Deep Value
Deep value is a sub-strategy I’m employing in my portfolio. This is a quantitative strategy that buys a basket of statistically cheap stocks. The metric I use is EV/EBIT, based on the wonderful book The Acquirers Multiple. Historically, this strategy has provided excellent returns, although it has not kept up with the S&P 500 the past few years. Additionally, I am making an effort to apply this strategy to microcap companies. Microcaps are classified as having a market capitalization between $50M-300M. These small companies are more volatile, but have the potential for attractive returns.
My position sizing is smaller than the discretionary side of my portfolio because I want to own a basket of about 20 stocks. Since this is a quantitative strategy, I do not spend much time analyzing these businesses. The main idea is that these companies are trading at very cheap valuations, and the winners will (hopefully) outnumber the losers.
Avg Price
Cost Basis
Current Value
Current Gain (Loss)
BCC
55.00
3,025.00
3,829.00
26.29%
BIIB
275.00
2,475.00
1,895.40
(23.42%)
BTG
5.25
2,499.00
2,184.84
(12.57%)
GTN
23.00
3,105.00
2,979.45
(4.04%)
HXL
36.80
1,803.20
2,914.03
61.60%
ITIC
164.54
1,974.48
2,438.52
23.50%
KOP
31.47
2,958.18
2,586.88
(12.55%)
MHO
60.00
2,520.00
1,862.70
(26.08%)
MSGE
95.24
2,000.00
1,749.51
(12.52%)
QDEL
120.00
2,520.00
2,361.66
(6.28%)
SENEA
50.00
3,000.00
3,092.40
3.08%
Tanker Stocks
Tankers are still trading a lot lower than my purchase price. I wouldn’t be opposed to selling these stocks. In the medium term, oil tankers should recover once oil demand rebounds from the pandemic.
Avg Price
Cost Basis
Current Value
Current Gain (Loss)
DHT
8.17
1,755.90
1,247.00
(28.98%)
FRO
10.66
1,738.29
1,434.00
(17.48%)
STNG
26.63
1,742.67
1,434.40
(16.57%)
TNK
23.86
1,765.88
1,024.16
(42.00%)
401k and Precious Metals
My 401k is through my current employer and actively receives contributions. The 401k consists of a Blackrock Target Date Fund (which is no longer being funded), and the Oakmark Fund. The Oakmark Fund is a large cap value fund. Since I am actively contributing to my 401k, it will naturally have a growing influence on my portfolio.
I also have a decent allocation to precious metals that are used as a bond substitute, recession and inflation hedge. The table below shows the YTD performance for the precious metals and 401k, which includes the effects of contributions.
12/31/21
12/31/21
YTD Gain (Loss)
YTD Contributions
Precious Metals
12,854.19
13,620.52
5.96%
0
401k
60,578.76
63,924.8
(4.23%)
9,087.14
Tail Hedging
This quarter I continued a tail hedging strategy that I have used in the past. The strategy involves buying 30% out of the money SPY put options that expire in a couple of months. Each month options are sold and a new set is bought. This quarter, the options have had a cost of $2,469.39, with proceeds of $1,152.97, leaving a net cost of $1,316.42.
For Q4 2021, the portfolio was up 2.7%, and finished the year up 20.6%. The Q4 starting balance was $146,562.65, and finished the quarter at $159,295.45. Contributions to the portfolio during the quarter amount to $9,390. The starting balance of the portfolio at the start of 2021 was $111,461.88. Total contributions to the portfolio for the year was $23,590, where $17,590 of that was 401k contributions.
A few new positions were added this quarter in several of the portfolio categories. On the discretionary side, Discovery Inc. (DISCK), and Qurate Retail (QRTEA) was purchased. The Deep Value category saw the addition of Boise Cascade Company (BCC), Gray Television (GTN), Seneca Foods Corp (SENEA), Koppers Holdings (KOP). This quarter saw more rebalancing of the precious metal holdings with additional purchase of the SLV silver ETF.
The current allocation of the portfolio is shown in the chart below. Currently, the portfolio consists of discretionary value stocks, oil tankers, deep value, 401k stocks, precious metals, and cash. It can be seen that 86.9% of the portfolio is in stocks, while 13.1% is in cash and safe haven assets.
During the quarter I received $1,397.62 total in dividends, which is broken down in the table below. The boost in dividends this quarter was due in large part to the special dividends paid by QRTEA, BCC, and ITIC. Total dividends received for the year amounted to $2,447.91.
Ticker
Quarterly Dividend
QRTEA
625.00
FE
48.75
BTI
137.13
GTN
10.80
BTG
19.04
STNG
6.80
BCC
171.60
DHT
4.30
ITIC
221.52
EMR
43.78
COF
33.00
SPG
75.90
Total
1,397.62
My Thoughts
One of the biggest financial stories this year was the meme stock phenomenon. AMC theaters and Gamestop were the two high profile meme stocks. In both cases, these companies were shorted by a few hedge funds. A group of amatuer speculators who gathered on Reddit were trying to create a short squeeze to cause large losses to the hedge funds, thereby sticking it to the man. Part of the motivation for the Reddit crowd was to inflict financial pain on firms involved with “payment for order flow”, and because they thought the hedge funds were intentionally trying to kill the meme stocks by shorting them. Also there was the promise of great riches if the Redditors did pull off the short squeeze.
The Reddit crowd had an arcane thesis on how to pull off the short squeeze, and to explain why the “mother of all squeezes” hasn’t happened yet, going on months, despite the hedge funds supposedly bleeding from the interest payments on their shorts. Support for this thesis included:
A get rich quick narrative
Complex financial terminology such as dark pools and naked short selling
Anecdotal evidence such as the Redditors control a large portion of the shares outstanding, and that the hedge funds interest payments are killing them
Logical fallacies such as ascribing the causation of a company going bankrupt due to short selling
Lucky for me, my investing strategy does not involve knowing what dark pools and naked shorting are. I basically try to buy boring, out of favor, maybe even hated stocks with the belief that eventually the market will forget why the company is out of favor. Most people would think it is no fun bragging to friends and family about owning shopping malls, HVAC equipment manufacturers, or electric utilities.
A key part of my investing philosophy is thinking in terms of years (sometimes decades) instead quarterly or long enough to make a quick buck. The power of compound interest is miraculous, however it takes years to appreciate its effects. It almost seems like it is a genetic mutation to be able to delay gratification, to be able to hold investments for the long term to let them compound. The simple recipe to do well financially is to live below your means, then invest your savings and not mess with it. Now I understand that it is easier said than done for some socio-economic cohorts, but the goal should be to make it practical for everyone to be able to save and invest. Unfortunately, we are all susceptible to get rich quick schemes. I am not too concerned about the person who throws a small amount of their money into this meme stock mania. What is more worrisome is the speculator who loses a substantial amount of their money, blames the system, and swears off the stock market…forgoing the tool of long term compounding.
Another big finance story this year was inflation. While pessimists have been calling for inflation for the past 10 years, now every day there is a news article discussing inflation. Much of the talk has been whether or not the price increases are “transitory”. I think the use of the word transitory is misleading, it implies that prices have risen, but will fall back to where they were. What economists and the Federal Reserve really mean is the rate of change in inflation is transitory, meaning the inflation rate goes from 2% to 7% back down to 2%. A large part of the inflation is due to the complex system that is our supply chains, where one bottleneck has massive ripple effects. Hopefully the supply chain works itself out soon, and luckily the fear mongers were wrong: we didn’t have any trouble getting our Christmas presents.
The other aspect of the inflation story is the labor shortages, which is a complicated topic. People can debate the pros and cons to the quickly rising wages, but what is certain is that the wage increases are not transitory. While I do not want to predict how long high inflation will persist, the point is that 2021 definitely experienced inflation.
Here is an example of the sting felt by this year’s 7% inflation print: I purchased British American Tobacco at an attractive 8% dividend yield, but real terms that is only a paltry 1% yield this year. Now think of the hurt from the people who own bonds that yield less than 1%. Luckily, BTI should have the ability to pass on price increases to its customers. Owning companies that have pricing power is one of the best ways to fight inflation.
In my strategy, I do not go out of my way to purchase investments to hedge inflation. However occasionally there is an overlap between a company that is undervalued and also has some degree of pricing power. These scenarios are a win-win. The investments in my portfolio that should navigate an inflationary environment reasonably well include British American Tobacco, Simon Property Group, oil tankers, precious metals, and potentially Capital One and First Energy.
In the past few years, Environment-Social-Governance (ESG) investing has increased in popularity. While I think businesses should be mindful of their ESG impact, I am not sure that there needs to be labels or a rating attached to companies. My impression is that many companies operate with short term thinking, like making sure next quarters earnings hit analyst projections. I would rather have companies focus on the long term, which should benefit the long term owners of that business. Perhaps I am being naive, but it would seem that a company needs to factor in all stakeholders to be successful over many decades, or else Karma would set them straight.
Another issue I have with the ESG movement is that Wall Street jumps in to create ESG funds that charge higher fees than a generic index fund. Oftentimes the holdings of the ESG fund are nearly identical to the broad index! With the rise of ESG funds, certain stocks and industries see increased buyers of their stock, while other industries are left behind. These companies left behind could present opportunities to investors. It is usually a good strategy to fish where no one else is fishing.
Discretionary Summary
Discretionary value is the label I’m giving to the positions that are fairly large (~5% of the portfolio) I believe are undervalued and may have the following characteristics: quality business, competitive advantage, misunderstood by the market, or a good company in a heavily sold off industry. The current discretionary value stocks I own consist of Capital One Financial (COF), Emerson Electric (EMR), Simon Property Group (SPG), FirstEnergy (FE), British American Tobacco (BTI), Qurate Retail (QRTEA), and Discovery Inc (DISCK). The table below shows the cost basis, current value, and gains/losses for these positions.
Emerson Electric and AspenTech Deal
The main piece of news this quarter was that Emerson announced a deal with the industrial software company AspenTech (AZPN). Emerson is providing AspenTech its industrial software subsidiaries, and $6B in order to have a 55% stake in the New AspenTech. New AspenTech will still be listed as (AZPN). After the deal, AZPN is expected to have FY 2020 revenues of $1.1B and EBITDA around $500M. The earnings of the new company will be consolidated to Emersons financials, so Emerson will directly benefit from any earnings growth the new company will experience. Usually Emerson buys entire companies, so they are mixing it up with this deal. Additionally, EMR has only been doing smaller acquisitions of late. In contrast, Emerson’s $6B outlay represents about 10% of their market cap. The deal is expected to close in the second quarter of 2022.
Discovery Inc. Purchase
The first addition to the portfolio this quarter was Discovery Inc. (DISCK). Discovery includes the cable TV station of the same name, as well as Food Network, HGTV, Animal Planet, plus others. The company has responded to declining cable viewership by introducing the Discovery+ streaming app. The bigger story is that Discovery is merging with Warner Media via a Reverse Morris Trust. Warner Media is currently a subsidiary of AT&T (T), and consists of Warner Brothers movie library and IP, HBO, and has HBO Max as a streaming option.
Warner’s movies and TV shows are big budget affairs, known for their quality. In contrast, Discovery’s main content is reality based TV shows that are cheap to make. These reality shows are nice background noise for a cable TV watcher who just wants to put on an entertaining show. Given this situation, it appears Discovery will have a tough time getting people to go out of their way to pay for their streaming content. However, Discovery’s reality based content coupled with Warner Media’s library of movies and TV shows should create a very strong package. It is possible Warner-Discovery could be in the top tier of streaming platforms in the coming years.
Despite all of this, investors seem to be quite pessimistic about Discovery, with its share price steadily decreasing ever since the merger was announced. I believe the negativity surrounding Warner-Discovery has to do with potential regulatory issues, complexity of the Reverse Morris Trust arrangement, the relatively high Debt/EBITDA the new company will have, and uncertainty in the war for streaming market share. I think the negativity is overblown, and that even if the deal did not pan out, DISCK would be undervalued. Additionally, the great capital allocator John Malone is a large shareholder of Discovery, and will be on the board of the new company. I don’t mind riding on people’s coattails…
Qurate Retail Purchase
The other large purchase this quarter is also involved in the John Malone complex of companies. This purchase was Qurate, which is a holding company that mostly consists of QVC and HSN cable TV channels. Shopping through cable TV would seem quite the melting ice cube with the trend of cord cutting and ecommerce, that is probably true. Despite these headwinds, Qurate’s sales primarily come from older women who may be slow to adapt to modern shopping. Additionally, a decent chunk of QRTEA’s sales come from “super users” who make many repeat purchases.
Even though Qurate’s bread and butter is cable TV, they are working on pivoting to the direct-to-consumer streaming model. Since the sentiment regarding Qurate is quite negative, the company trades at a price to free cash flow multiple of around 4, which is very cheap. The company’s capital allocation policy involves returning most of the cash flow back to shareholders instead of reinvesting in its low growth business. Qurate does not pay regular dividends, but pays a hefty special dividend. In my view, QRTEA will not shrink as fast as people think, and if they nail the landing with their streaming strategy then the business could be generating cash for years to come.
Avg Price
Cost Basis
Current Value
Current Gain (Loss)
COF
63.25
3,478.75
7,979.95
130.25%
EMR
41.00
3,485.00
7,902.45
126.76%
SPG
74.50
3,427.00
7,349.42
114.46%
FE
28.00
3,500.00
5,198.75
48.54%
BTI
37.45
7,114.91
7,107.90
-0.01%
QRTEA
7.60
5,700
5,700.00
0.0%
DISCK
24.50
4,165.00
3,893.00
-6.53%
Tanker Stocks
Tankers are still trading a lot lower than my purchase price. I wouldn’t be opposed to selling these stocks. In the medium term, oil tankers should recover once oil demand rebounds from the pandemic.
Avg Price
Cost Basis
Current Value
Current Gain (Loss)
DHT
8.17
1,755.90
1,115.85
-36.45%
FRO
10.66
1,738.29
1,152.41
-33.70%
STNG
26.63
1,742.67
871.08
-50.01%
TNK
23.86
1,765.88
806.60
-54.32%
Deep Value
Deep value is a sub-strategy I’m employing in my portfolio. This is a quantitative strategy that buys a basket of statistically cheap stocks. The metric I use is EV/EBIT, based on the wonderful book The Acquirers Multiple. Historically, this strategy has provided excellent returns, although it has not kept up with the S&P 500 the past few years. Additionally, I am making an effort to apply this strategy to microcap companies. Microcaps are classified as having a market capitalization between $50M-300M. These small companies are more volatile, but have the potential for attractive returns.
My position sizing is smaller than the discretionary side of my portfolio because I want to own a basket of about 20 stocks. Since this is a quantitative strategy, I do not spend much time analyzing these businesses. The main idea is that these companies are trading at very cheap valuations, and the winners will (hopefully) outnumber the losers.
Avg Price
Cost Basis
Current Value
Current Gain (Loss)
BCC
55.00
3,025.00
3,916.00
29.45%
BIIB
275.00
2,475.00
3,116.43
-12.76%
BTG
5.25
2,499.00
2,003.96
-25.14%
GTN
23.00
3,105.00
2721.6
-12.35%
HXL
36.80
1,803.20
3,057.60
40.76%
ITIC
164.54
1,974.48
2,095.56
19.82%
KOP
31.47
2,958.18
2942.2
-0.54%
MHO
60.00
2,520.00
2611.56
3.63%
MSGE
95.24
2,000
1477.14
-26.14%
QDEL
120.00
2,520.00
2834.79
12.49%
SENEA
50.00
3,000
2877
-4.10%
No deep value positions were sold this quarter. Additions to this section of the portfolio include Boise Cascade Company (BCC), Gray Television (GTN), Seneca Foods Corp (SENEA), Koppers Holdings (KOP).
401k and Precious Metals
My 401k is through my current employer and actively receives contributions. The 401k consists of a Blackrock Target Date Fund (which is no longer being funded), and the Oakmark Fund. The Oakmark Fund is a large cap value fund. Since I am actively contributing to my 401k, it will naturally have a growing influence on my portfolio.
I also have a decent allocation to precious metals that are used as a bond substitute, recession and inflation hedge. This quarter, I added another 49 units of iShares Silver Trust (SLV) at a cost basis of $21.71 a unit. The table below shows the YTD performance for the precious metals and 401k, which includes the effects of contributions.
12/31/20
12/31/21
YTD Gain (Loss)
YTD Contributions
Precious Metals
9,964.00
12,854.19
-2.91%
2,054
401k
32,252.43
60,578.76
26.96%
17,590.00
Tail Hedging
This quarter I reimplemented a tail hedging strategy that I have used in the past. The strategy involves buying 30% out of the money SPY put options that expire in a couple of months. Each month options are sold and a new set is bought. This quarter the options have had a cost of $1,652, with proceeds of $472, leaving a net cost of $1,180.
For Q3 2021, the portfolio is down 0.65%, and up 17.4% YTD. The Q1 starting balance was $144,722.98, and finished the quarter at $147,690.65. Contributions to the portfolio during the quarter amount to $3,948.
A few new positions were added this quarter in several of the portfolio categories. On the discretionary side, British American Tobacco (BTI) was purchased. The Deep Value category saw the addition of M/I Homes (MHO). Finally, SLV silver ETF was added to the precious metals holdings.
The current allocation of the portfolio is shown in the chart below. Currently, the portfolio consists of discretionary value stocks, oil tankers, deep value, 401k stocks, precious metals, and cash. It can be seen that 72.1% of the portfolio is in stocks, while 27.9% is in cash and safe haven assets.
During the quarter I received $231.90 total in dividends, which is broken down in the table below.
Ticker
Quarterly Dividend
FE
48.75
DHT
4.30
ITIC
5.52
EMR
42.93
COF
66.00
SPG
64.40
Total
231.90
Discretionary Summary
Discretionary value is the label I’m giving to the positions that are fairly large (~5% of the portfolio) I believe are undervalued and may have the following characteristics: quality business, competitive advantage, misunderstood by the market, or a good company in a heavily sold off industry. The current discretionary value stocks I own consist of Capital One Financial (COF), Emerson Electric (EMR), Simon Property Group (SPG), FirstEnergy (FE), British American Tobacco (BTI). The table below shows the cost basis, current value, and gains/losses for these positions.
The newest addition to the discretionary portfolio was the purchase of British American Tobacco. Cigarette volumes have been declining at a rate of 5% annually, and that trend is expected to continue. BTI is preparing for a “post-cigarette” world by developing alternative tobacco products that they claim is much more safe than combustables. While ESG funds are not allowed to own British American Tobacco, I don’t mind BTI’s 8% dividend yield.
Capital One recently announced they will enter the Buy-Now-Pay-Later (BNPL) space to compete with companies like Affirm. BNPL seems like a crowded space, so it will be interesting to see if COF can make an impact. With this announcement, it looks like I will be doing some homework on the competition..
First Energy announced their settlement with the DOJ concerning their bribery scandal. The company will pay $115 million to the US Treasury, and another $115 million to Ohio utility customers. These payments will be spread out over three years. With this scandal receding into the background, hopefully FE can revert to their pre-scandal price.
Avg Price
Cost Basis
Current Value
Current Gain (Loss)
COF
63.25
3,478.75
8,507.95
144.57%
EMR
41.00
3,485.00
8,180.40
134.73%
SPG
74.50
3,427.00
6,002.08
75.14%
FE
28.00
3,500.00
4,651.25
32.89%
BTI
37.45
7,114.91
6,703.20
(5.78%)
Tanker Stocks
Tankers have slightly improved this quarter, but are still a sore point in my portfolio. I wouldn’t be opposed to selling these stocks. However, I don’t have any better ideas, I already have a large cash position, and there is some hope they will work out in the medium term.
Avg Price
Cost Basis
Current Value
Current Gain (Loss)
DHT
8.17
1,755.90
1,395.35
-20.53%
FRO
10.66
1,738.29
1,467.00
-15.60%
STNG
26.63
1,742.67
1,499.40
-13.96%
TNK
23.86
1,765.88
1,067.08
-39.57%
Deep Value
Deep value is a sub-strategy I’m employing in my portfolio. This is a quantitative strategy that buys a basket of statistically cheap stocks. The metric I use is EV/EBIT, based on the wonderful book The Acquirers Multiple. Historically, this strategy has provided excellent returns, although it has not kept up with the S&P 500 the past few years. Additionally, I am making an effort to apply this strategy to microcap companies. Microcaps are classified as having a market capitalization between $50M-300M. These small companies are more volatile, but have the potential for attractive returns.
My position sizing is smaller than the discretionary side of my portfolio because I want to own a basket of about 20 stocks. Since this is a quantitative strategy, I do not spend much time analyzing these businesses. The main idea is that these companies are trading at very cheap valuations, and the winners will (hopefully) outnumber the losers.
Note: MSGN merged with MSGE during the quarter
Avg Price
Cost Basis
Current Value
Current Gain (Loss)
BIIB
275.00
2,475.00
3,116.43
25.91%
BTG
5.25
2,499.00
2,003.96
-19.81
HXL
36.80
1,803.20
3,057.60
69.56%
ITIC
164.54
1,974.48
2,095.56
6.13%
MSGE
16.00
2,000.00
1,822.50
-8.88
QDEL
120.00
2,520.00
2,690.52
6.77%
MHO
60.00
2,520.00
2,427.60
(3.67%)
RSKIA, FF, and BBSI were sold this quarter since I’ve held them for a year. RSKIA and BBSI realized attractive gains, while FF produced a loss. Last quarter Future Fuel paid out a special dividend, which I received about $300. With this special dividend, my return with FF was closer to breaking even. The new addition this quarter was the home builder M/I Homes (MHO).
Cost Basis
Sale Proceeds
Realized Gain (Loss)
RSKIA
1,740.75
2,690.23
54.54%
FF
1,794.00
1,310.99
(26.92%)
BBSI
1,767.50
2,572.48
45.54%
401k and Precious Metals
My 401k is through my current employer and actively receives contributions. The 401k consists of a Blackrock Target Date Fund (which is no longer being funded), and the Oakmark Fund. The Oakmark Fund is a large cap value fund. Since I am actively contributing to my 401k, it will naturally have a growing influence on my portfolio.
I also have a decent allocation to precious metals that are used as a bond substitute, recession and inflation hedge. This quarter, I added 100 units of iShares Silver Trust (SLV) at a cost basis of $20.52 a unit. The table below shows the YTD performance for the precious metals and 401k, which includes the effects of contributions.
12/31/20
9/30/21
YTD Gain (Loss)
YTD Contributions
Precious Metals
9,964.00
9,682.04
-6.84%
2,054
401k
32,252.43
54,845.18
21.91%
14,200.00
Books I’m Reading
This quarter I read “Kochland: The Secret History of Koch Industries and Corporate Power in America”. Prior to reading the book, I was not too familiar with the Koch brothers besides them controlling the largest private company in the country, them being libertarians, and that they are controversial. This book covers the history of Koch Industries, Charles Koch’s management philosophy, various Koch Industry scandals, and Charles Koch’s lobbying machine. Kochland has a somewhat negative bias against Charles Koch, which I kind of knew before reading, so the negative portrayal did not bother me.
Much of the book consisted of explaining how Koch Industries went into a new line of business, then some crises happened in that new business, then presenting 1st hand accounts from key people navigating said crisis. This process repeated several times. The book did provide a good overview of the history of the company. I wish it provided more financial data, but apparently Koch Industries is extremely secretive so that info is not usually released.
The chapters on Charles Koch’s political network were very interesting. I was not aware of how impactful Koch’s lobbying groups were at amplifying the Tea Party movement, blocking climate legislation, and meddling with Trump’s tax plan. Overall the book was quite the page turner, I just might seek out other books on Koch Industries to get an additional perspective.
For Q2 2021, the portfolio is up 6.37%, and up 18% YTD. The Q2 starting balance was $132,799.55, and finished the quarter at $144,722.98. Contributions to the portfolio during the quarter amount to $3,386.
A few new positions were added this quarter in the deep value category. These include Biogen, MSG Networks, Investors Title Co, Quidel, and B2Gold. Additionally, Richardson Electronics was sold for a gain.
The current allocation of the portfolio is shown in the chart below. Currently, the portfolio consists of discretionary value stocks, oil tankers, deep value, 401k stocks, precious metals, and cash. It can be seen that 72.1% of the portfolio is in stocks, while 27.9% is in cash and safe haven assets.
During the quarter I received $587.72 total in dividends, which is broken down in the table below. It should be noted that FutureFuel paid a special dividend in addition to their normal dividend, which amounted to $345.
Ticker
Quarterly Dividend
FF
353.28
STNG
6.80
FE
48.75
DHT
8.60
BTG
19.04
ITIC
5.52
BBSI
21.00
EMR
42.93
COF
22.00
SPG
59.80
Total
587.72
Discretionary Summary
Discretionary value is the label I’m giving to the positions that are fairly large (~5% of the portfolio) I believe are undervalued and may have the following characteristics: quality business, competitive advantage, misunderstood by the market, or a good company in a heavily sold off industry. The current discretionary value stocks I own consist of Capital One Financial (COF), Emerson Electric (EMR), Simon Property Group (SPG), and FirstEnergy (FE). The table below shows the cost basis, current value, and gains/losses for these positions.
Recently, FirstEnergy announced a deferred prosecution agreement with the DOJ. This will probably result in a fine, and hopefully the scandal will be put to rest. The Fed released the results of their latest bank stress test. Capital One was one of the strongest performers in the stress test, meaning. COF has plenty of excess capital to weather a storm. Or since it appears things are returning to normal, hopefully Capital One can return some of this cash to shareholders.
Avg Price
Cost Basis
Current Value
Current Gain (Loss)
COF
63.25
3,478.75
8,507.95
144.57%
EMR
41.00
3,485.00
8,180.40
134.73%
SPG
74.50
3,427.00
6,002.08
75.14%
FE
28.00
3,500.00
4,651.25
32.89%
Tanker Stocks
Tankers have slightly improved this quarter, but are still a sore point in my portfolio. I wouldn’t be opposed to selling these stocks. However, I don’t have any better ideas, I already have a large cash position, and there is some hope they will work out in the medium term.
Avg Price
Cost Basis
Current Value
Current Gain (Loss)
DHT
8.17
1,755.90
1,395.35
-20.53%
FRO
10.66
1,738.29
1,467.00
-15.60%
STNG
26.63
1,742.67
1,499.40
-13.96%
TNK
23.86
1,765.88
1,067.08
-39.57%
Deep Value
Deep value is a sub-strategy I’m employing in my portfolio. This is a quantitative strategy that buys a basket of statistically cheap stocks. The metric I use is EV/EBIT, based on the wonderful book The Acquirers Multiple. Historically, this strategy has provided excellent returns, although it has not kept up with the S&P 500 the past few years. Additionally, I am making an effort to apply this strategy to microcap companies. Microcaps are classified as having a market capitalization between $50M-300M. These small companies are more volatile, but have the potential for attractive returns.
My position sizing is smaller than the discretionary side of my portfolio because I want to own a basket of about 20 stocks. Since this is a quantitative strategy, I do not spend much time analyzing these businesses. The main idea is that these companies are trading at very cheap valuations, and the winners will (hopefully) outnumber the losers.
Avg Price
Cost Basis
Current Value
Current Gain (Loss)
BIIB
275.00
2,475.00
3,116.43
25.91%
BTG
5.25
2,499.00
2,003.96
-19.81
FF
13.00
1,794.00
1,324.80
-26.15%
HXL
36.80
1,803.20
3,057.60
69.56%
ITIC
164.54
1,974.48
2,095.56
6.13%
MSGN
16.00
2,000.00
1,822.50
-8.88
QDEL
120.00
2,520.00
2,690.52
6.77%
RSKIA
8.25
1,740.75
2,743.00
57.57%
Since I sold some deep value stocks last quarter, I used the proceeds to buy a few new companies this quarter. The new additions are Biogen (BIIB), B2Gold (BTG), Investors Title Co (ITIC), MSG Networks (MSGN), and Quidel (QDEL). Some of the remaining deep value picks, such as FF and RKIA, are coming to their one year anniversary so they will probably be sold next quarter. Finally, Richardson Electronics was sold this quarter for a nice gain.
Cost Basis
Sale Proceeds
Realized Gain (Loss)
RELL
1,802.25
2,997.32
66.31%
401k and Precious Metals
My 401k is through my current employer and actively receives contributions. The 401k consists of a Blackrock Target Date Fund (which is no longer being funded), and the Oakmark Fund. The Oakmark Fund is a large cap value fund. Since I am actively contributing to my 401k, it will naturally have a growing influence on my portfolio.
I also have a decent allocation to precious metals that are used as a bond substitute, recession and inflation hedge. The table below shows the YTD performance for the precious metals and 401k, which includes the effects of contributions.
12/31/20
6/30/21
YTD Gain (Loss)
YTD Contributions
Precious Metals
9,964.00
9,682.04
-2.83%
401k
32,252.43
49,930.84
19.68%
10,252.00
Books I’m Reading
One of my recent reads was “The Go-Go Years: The Drama and Crashing Finale of Wall Street’s Bullish 60’s”. I was looking for a market history book that covered the 1960’s market boom, then the stagflation bear market of the 70’s. A part of me feels like history is repeating, so I was interested in learning more about this time period and I’ve heard this book mentioned before. Unfortunately, Go-Go Years does not cover the high inflation of the 1970’s. It is mostly focused on the 60’s and ends with the recession in 1970. Despite this, the book was still quite interesting because I was not aware of all the stock market drama going on in the 1960’s.
The book starts off early in the decade, painting the picture of a market moved by individuals instead of institutions. Then the growth mutual funds pioneered by George Tsai, and copied by many, took advantage of the technology companies of the day. Conglomerates became a new phenomenon with Textron, Litton Industries, Gulf+Western and the like. Financial engineering and shoddy accounting was spreading throughout corporate America. Go-Go Years culminated with the 1970 recession that crushed the overleveraged stock brokerage industry. This era does not get mentioned as much as 1929 or 2008, but if you enjoy market history, Go-Go Years is a good read.
The second book I read this quarter was the personal finance classic “The Millionaire Next Door: The Surprising Secrets of America’s Wealthy”. I thought I knew the gist of the book, “live below your means and invest”, but Millionaire Next Door presented some interesting information that made it an enjoyable read. Many of the millionaires profiled in the book come from humble, or even poor beginnings, yet they build a small company, save, and invest. The example millionaires were frugal, but to my surprise, they didn’t drive 15 year old Honda Civics. The authors’ surveys found that many of the self made millionaires bought newer cars, they just bought Cadillac’s and Ford Explorers instead of high end BMW’s. A big theme of the book was that you can have a high income, but if you spend it all on status items you can look rich but actually have little net worth. Now whenever I think about making a big purchase, I’ll ask myself “What would a millionaire next door do?”.
This post contains affiliate links. If you use these links to buy something I may earn a commission. Thanks for your support.
Performance Overview
For Q1 2021, the portfolio is up 11.09%. The Q1 starting balance was $113,027.88, and finished the quarter at $132,799.55. Contributions to the portfolio during the quarter amount to $6,866.
No stocks were bought this quarter, however a few positions were sold. Paul Mueller Co, Friedman Industries, and Surge Components were all sold for a gain.
The current allocation of the portfolio is shown in the chart below. Currently, the portfolio consists of discretionary value stocks, oil tankers, deep value, 401k stocks, precious metals, and cash. It can be seen that 64.2% of the portfolio is in stocks, while 35.8% is in cash and safe haven assets.
During the quarter I received $230.67 total in dividends, which is broken down in the table below.
Ticker
Quarterly Dividend
FF
8.28
STNG
6.80
FE
48.75
DHT
10.75
RELL
24.30
FRD
7.06
EMR
42.93
COF
22.00
SPG
59.80
Total
230.67
My Thoughts
I don’t have much thoughts this quarter, except to say that the r/wallstreetbets and GameStop ordeal is dumb.
Discretionary Summary
Discretionary value is the label I’m giving to the positions that are fairly large (~5% of the portfolio) I believe are undervalued and may have the following characteristics: quality business, competitive advantage, misunderstood by the market, or a good company in a heavily sold off industry. The current discretionary value stocks I own consist of Capital One Financial (COF), Emerson Electric (EMR), Simon Property Group (SPG), and FirstEnergy (FE). The table below shows the cost basis, current value, and gains/losses for these positions.
The only bit of news with these stocks is that Emerson’s long time CEO David Farr retired, replaced by Lal Karsanbhai. A long tenured, quality CEO is a consideration when looking for quality companies. I will have to keep an eye on the new management to see how their capital allocation stacks up.
Avg Price
Cost Basis
Current Value
Current Gain (Loss)
COF
63.25
3,478.75
6,997.65
101.15%
EMR
41.00
3,485.00
7,668.70
120.05%
SPG
74.50
3,427.00
5,233.42
52.71%
FE
28.00
3,500.00
4,336.25
23.89%
Tanker Stocks
Tankers have slightly improved this quarter, but are still a sore point in my portfolio. I wouldn’t be opposed to selling these stocks. However, I don’t have any better ideas, I already have a large cash position, and there is some hope they will work out in the medium term.
Avg Price
Cost Basis
Current Value
Current Gain (Loss)
DHT
8.17
1,755.90
1,274.95
-27.39%
FRO
10.66
1,738.29
1,165.45
-32.95%
STNG
26.63
1,742.67
1,255.28
-38.82%
TNK
23.86
1,765.88
1,028.6
-41.75%
Deep Value
Deep value is a sub-strategy I’m employing in my portfolio. This a quantitative strategy that buys a basket of statistically cheap stocks. The metric I use is EV/EBIT, based on the wonderful book The Acquirers Multiple. Historically, this strategy has provided excellent returns, although it has not kept up with the S&P 500 the past few years. Additionally, I am making an effort to apply this strategy to microcap companies. Microcaps are classified as having a market capitalization between $50M-300M. These small companies are more volatile, but have the potential for attractive returns.
My position sizing is smaller than the discretionary side of my portfolio because I want to own a basket of about 20 stocks. Since this is a quantitative strategy, I do not spend much time analyzing these businesses. The main idea is that these companies are trading at very cheap valuations, and the winners will (hopefully) outnumber the losers.
Avg Price
Cost Basis
Current Value
Current Gain (Loss)
BBSI
50.50
1,767.50
2,410.10
36.34%
FF
13.00
1,794.00
2,005.14
11.77%
HXL
36.80
1,803.20
2,744.00
52.17%
RELL
4.45
1,802.25
2,579.85
43.14%
RSKIA
8.25
1,740.75
2,795.77
60.61%
This quarter I sold off three of these deep value positions. Paul Mueller Co was sold for a 102.5% gain, Friedman Industries for a 65.67% gain, and Surge Components for a 120.77% gain. With this quantitative strategy, I would typically hold the stocks for one year, then rebalance into a fresh set of undervalued stocks. I sold MUEL and SPRS early because they have run up massively lately. It would be expected that some of these microcaps will shoot up in price randomly. But over the past few months, it seems like all of these small deep value companies are rapidly rising. Maybe I’ll regret selling too early, but it seems hard to regret taking a 120% gain. As for FRD, it was a net-net when I bought it. The price reverted back to its net current asset value, so I made my exit.
Cost Basis
Sale Proceeds
Realized Gain (Loss)
MUEL
1,768.00
3,580.18
102.5%
FRD
1,800.10
2,982.13
65.67%
SPRS
1,819.30
4,016.47
120.77%
401k and Precious Metals
My 401k is through my current employer and actively receives contributions. The 401k consists of a Blackrock Target Date Fund (which is no longer being funded), and the Oakmark Fund. The Oakmark Fund is a large cap value fund. Since I am actively contributing to my 401k, it will naturally have a growing influence on my portfolio.
I also have a decent allocation to precious metals that are used as a bond substitute, recession and inflation hedge. The table below shows the YTD performance for the precious metals and 401k, which includes the effects of contributions.
12/31/20
3/31/21
YTD Gain (Loss)
YTD Contributions
Precious Metals
9,964.00
9,281.20
-6.85%
401k
32,252.43
43,020.27
10.93%
6,866.00
Books I’m Reading
The Outsiders: Eight Unconventional CEOs and Their Radically Rational Blueprint for Success was a book that I kept hearing people talk about, so I finally read it. The CEOs covered in this book include Warren Buffett, John Malone, Catherine Graham, Tom Murphy, Henry Singleton, Bill Anders, Bill Stiritz, and Dick Smith. Obviously I’m familiar with Buffett, and knew a little about some of these CEOs. However, it was nice to read about these capital allocators at General Dynamics, Ralston Purina, General Film, that I never heard of. The book emphasizes how these CEOs outperformed Jack Welch of GE, the poster boy of a successful CEO. Each of these CEOs focused on going against the herd, and expertly allocating capital instead of doing dumb acquisitions, or focusing on quarterly results. This book was a quick read, and very much enjoyable.
The second book I read this quarter was Skyscraper Dreams: The Great Real Estate Dynasties of New York. Dynasties is a good word to describe these New York real estate players since many of these are multi-generational family businesses, which I found fascinating. The book starts with Manhattan back when it was mostly fields, and progresses towards the early 1900’s where skyscrapers appear onto the scene. As the 20th century unfolds, you learn about the skyscraper boom leading up to the Depression, the post-war boom, the changing of the guard in the 1960’s, and New York’s financial woes in the 1970’s. I wasn’t too familiar with NYC history, let alone the stories of the people who built it. If you’re interested in a financial history book that’s a bit different than stock investing or business, I recommend this one.
Lately I’ve been investigating high quality companies so that I can be prepared during the next market selloff. Union Pacific was the first company I analyzed in this quest. Now in this post, I am analyzing Brown-Forman (I may have sampled some of their products for “research”). What I’m trying to understand is the business model, the company’s products, analyze the financials, and try to do a rough valuation. The goal is to determine if I should put Brown-Forman on my watchlist, or pass on it for a different idea.
Business Description
Brown-Forman (BF) is one of the largest American spirits companies. BF owns a portfolio of brands, but is most known for their Jack Daniels whiskey. The company is family controlled and has two share classes. The family controls most of BF-A which has all the voting power, while BF-B does not have any voting power. Brown-Forman is headquartered in Louisville, Kentucky. The company was founded in 1870, and went public in 1933, so it’s been around for a while.
For a quick history lesson, Brown-Forman’s first product was Old Forester whiskey. Their claim to fame is that Old Forester was the first whiskey to be sold in a sealed glass bottle. Early on, the company bought whiskey from other distilleries and blended them for sale. Eventually, BF purchased their own distillery plant. In the 1950’s, Brown-Forman purchased the Jack Daniels brand, which is now a huge brand. I find it interesting that Old Forester was BF’s original brand, but now Jack Daniel’s is the core of the company.
Product Line
Brown-Forman has many brands spread across the different types of liquor. The following is just the highlights of BF’s product line. Whiskey forms the core of the company, with Jack Daniels. There is also Old Forester, the premium Woodford Reserve line, and the low-end Early Times. Brown-Forman also owns the well known Canandian Mist brand, but they are in the process of selling it. Fairly recently, BF has acquired several scotch distilleries that includes the BenRiach, GlenDronach, and Glenglassaugh brands.
The company owns a California winery, Sonoma-Cutrer, as well as Korbel sparkling wine. In the vodka department BF has the Finlandia brand. As for tequila, they have the el Jimador and Herradura brands.
The Jack Daniel’s “Ready to Drink” products are like a cocktail in a can. These are geared towards younger people to introduce the Jack Daniel’s brand.
The past few years have seen different Jack Daniel’s flavors such as honey or apple being released that have boosted growth. Then you have all the various whiskey age/barrell variety combinations such as Woodford Reserve Double Oak.
Summary Statistics
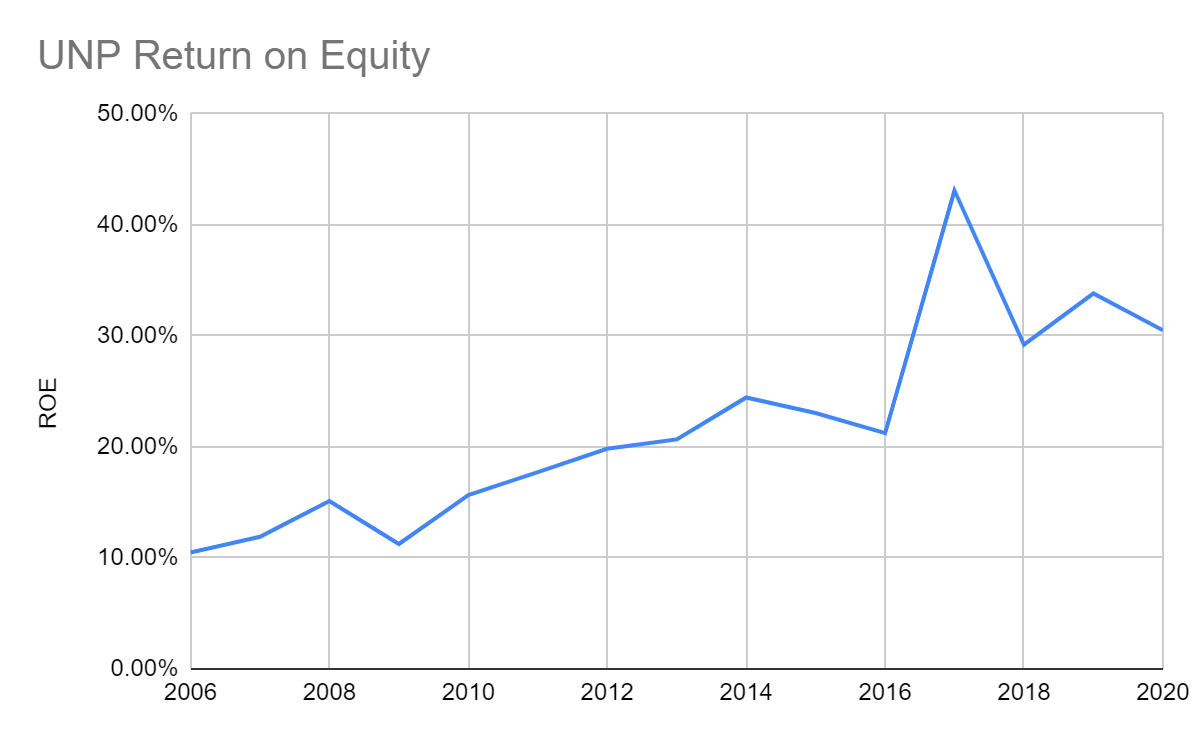
The table shows various summary statistics of Brown-Forman. The company is about $30B in size, which makes it a mid-cap these days? The valuation ratios indicate that BF is pretty expensive, which we’ll get to later. Right now, the price of Brown-Forman is around $70 a share, but during the March 2020 selloff it was near $50. Return on equity is at 37%, suggesting this is a quality company. The debt levels are fairly reasonable with a D/E around 1 and Debt/EBITDA around 2. Some might say Brown-Forman could/should increase their debt load a bit since they are a quality company and interest rates are low. However I tend to prefer less debt. I’m estimating earnings growth around 4% based on historical growth. I’m not making any fancy projections, but slightly above inflation seems reasonable.
Market Capitalization
$32B
Enterprise Value
$34B
P/E
36
EV/EBIT
33
52 Week Price
$52-82
ROE
37%
D/E
1.07
Debt/EBITDA
1.98
Earnings Growth
~4%
Financials
Here I summarize Brown-Forman’s financials based on their income statement, balance sheet, and cash flow statement. I believe that taking a look at a company’s financials is key before making an investment.
Income Statement
In 2020 Brown-Forman produced revenue of $3.36 billion. It should be noted that their fiscal year ends in April, so these financials are only showing the beginning of the pandemic. Looking at the profit margins, we see a gross margin at 61%, operating margin of 31%, and a net margin of 27%. These are definitely attractive margins, which further supports that BF is a high quality company.
The income statement is summarized in the pie chart below where the entire pie is Brown-Forman’s revenue. It can be seen that the cost of goods sold and SG&A are the main expenses. Income tax, interest, and depreciation make up a pretty small slice of expenses. In summary, the income statement looks pretty straightforward with a healthy net income.
Assets
Next, let’s take a look at Brown-Forman’s balance sheet. The assets are broken down in the chart below (some smaller line items are omitted for clarity). The first thing to note is the $1.1B in cash, making up about 17% of their assets. Inventory is recorded at $1.72B. It’s a bit funny thinking about $1.7 billion in liquor sitting around. The rest of the assets appear reasonable with property and plant taking up a decent chunk. The amount of intangibles is expected from a company with strong brands. Finally, there is some goodwill, reflecting the acquisitions BF has made. The high cash balance would seem to support a strong balance sheet, and the rest of the assets are as you would expect.
Liabilities
For the liabilities side of Brown-Forman’s balance sheet, the main line item is the $2.3B in long term debt. This amount of debt is fine since there is $1.1B in cash available that could wipe out most of it. Short term debt is at $312M, which most of it was raised in 2020. The other thing to note from Brown-Forman’s liabilities is the pension liability, which most companies these days don’t provide a pension. Like the assets, there is nothing out of the ordinary or any red flags with BF’s liabilities.
Cash Flow
The table belows shows a simplified view of Brown-Forman’s cash flow statement. Looking at 2019 and 2020, BF’s operating cash flow is between $700-800M. In both years, capex is about the same being around $120M. It would be useful to find out if this is maintenance capex, or used to build new PP&E that could provide growth. There were no acquisitions in 2019, but a small one in 2020.
Cash from financing first consists of raising $178M of short term debt in 2020. Buybacks were performed in 2019 to the tune of $207M, but none were during 2020. Brown-Forman seems to do sporadic buybacks so I’m not sure if the lack of buybacks in 2020 is COVID related, or just coincidence. Finally, in both years the dividend is a bit north of $300, with BF maintaining their record of increasing their dividend annually. Brown-Forman’s cash flow statement is pretty straightforward. The cash flow statement can provide good insights on the company’s capital allocation, so the simpler the better.
($M)
2020
2019
Cash From Operations
724
800
Capex
(113)
(119)
Acquisition
(22)
0
Cash From Investing
(141)
(119)
Short Term Debt
178
71
Buyback
(1)
(207)
Dividend
(325)
(310)
Cash From Financing
(191)
(599)
Change in Cash
368
68
Capital Allocation
A company’s capital allocation strategy is key to having strong long term performance. Here I will try to summarize Brown-Forman’s capital allocation based on my light research. In 2016, BF sold the popular Southern Comfort brand. The company is currently in the process of selling Canadian Mist. I find it interesting that BF is selling these well known brands, but presumably they are selling them for an attractive price. On the other hand, Brown-Forman has been acquiring assets such as the scotch brands, and the recent acquisition of Ford’s gin. It appears BF has a thought out strategy to reorient their portfolio of brands.
The other key area of capital allocation is return profits back to shareholders. As mentioned above, BF repurchased $207M shares in 2019. Oddly, BF did not repurchase any shares in 2018, but did buyback $571M in 2017. The large 2017 repurchase may be due to the sale of Southern Comfort in 2016. I’m not sure if Brown-Forman is only buying back their share at what they think are attractive prices, or if there is another reason for these sporadic purchases.
On the dividend front, Brown-Forman is a dividend aristocrat, consistently paying a dividend for 76 years, and raising the dividend for 37 straight years. While sometimes it can be suboptimal to pay a dividend, Brown-Forman is a high quality, low growing company, so it seems reasonable. The dividend payout ratio is 37%, which leaves the company with plenty of retained earnings to reinvest.
Brown-Forman Valuation
Oftentimes when I value a company, I use a basic discounted cash flow analysis to get a rough fair value. Looking at Brown-Forman’s free cash flow the past few years, a reasonable figure to use in the DCF is about $700M. For the growth rate, I’m using 4% based on BF’s past growth. This growth rate is slightly above inflation, which seems appropriate. Typically, I would use a 10% discount rate, but doing so for Brown-Forman would produce a much lower fair value than what the stock is trading at. In this case, I reverse engineered what discount rate the market is implying. The discount rate I came up with is 4.5%. This is a very low discount rate. However BF is a quality stock, so it makes sense that the market would be discounting it slightly above the risk free rate.
Putting all these variables together, we get a fair value around $65 which is near what the stock is trading at today. The 4.5% discount rate implies that if you bought it today, you would expect to receive a 4.5% return by holding for the long term. This rate of return is far lower than I would be trying to achieve.
But you have to consider that I’m competing against pension funds, endowments, and other institutional investors that are willing to accept lower returns. These funds need a replacement for bonds since interest rates are so low. Therefore, they look at quality companies as an alternative, bidding up the valuation. A quality company that is slightly growing, paying a little dividend, and doing some share buybacks is a lot more attractive than a bond yielding 2%. So all that to say, Brown-Forman is not currently attractive for me, but I understand why it is at this valuation.
Buying the Dip
While Brown-Forman does not provide the most attractive return at its current price, occasionally the stock sells off like March 2020. During that period, BF dropped to about $50 a share. If you were lucky enough to buy it at this low price, you would experience about a 40% gain as the stock reverted back to $70. A 40% gain, then compounding at 4.5% into the future, should produce a decent internal rate of return if held for 5 years or so. Obviously this only works if the stock reverts back to its prior valuation. My conclusion is that if I were to buy some Brown-Forman, I would wait until there was a panic and Mr. Market could offer me a once in ~7 year deal.
Brown-Forman During Inflation
Another aspect I want to consider is how Brown-Forman would perform during an inflationary period. On one hand, BF’s multiple could compress if interest rates go from low to high(er). Since Brown-Forman is so richly valued because of low interest rates, if rates increased then investors would have to increase their discount rates. It would seem reasonable that the share price of BF would take a hit during this period.
On the other hand, Brown-Forman should be able to easily increase the price of its products during an inflationary period. While i need to do more research, I would think that people buying liquor are pretty price insensitive, especially when all brands would be raising prices with inflation. Another point is that BF does not have heavy capex needs. Companies that have to constantly overhaul their factories would be forced to pay ever increasing prices for equipment during inflation.
Based on this, it is possible that Brown-Forman’s business would do ok during an inflationary environment, but the stock price could languish. Perhaps if this scenario played out, it would be a good opportunity to dollar cost average into the company.
Business Risks
While Brown-Forman is a quality company, there are still a few risks worth further researching. One unique problem with liquor is that some of the products need to be aged for 5+ years. This means you have to predict what demand will be like far into the future, which is hard. Over the past 10 years, whiskey has been trendy. If the trend passes, then demand could be much lower in the future.
The Jack Daniel’s brand is vital to Brown-Forman. If somehow, the Jack Daniel’s brand fell from grace, then BF would be in some hard times.
In 2018 the EU enacted tariffs against Jack Daniel’s in retaliation to the Trump administration’s tariffs on steel. I guess they targeted Jack Daniel’s since it is a quintessential American brand. Apparently the EU tariffs are supposed to double in June 2021 if the trade relations do not approve.
Government regulation could negatively impact Brown-Forman. Alcohol has tricky advertising regulations across different countries. Governments could also impose gaudier warnings labels, which could affect sales.
Finally, I have anecdotally heard that cannabis could take market share from liquor companies. I don’t know anything about the cannabis industry, but this threat seems somewhat reasonable. On the flip side, I guess nothing stops Brown-Forman from making a cannabis infused tequila or something.
Conclusion
After analyzing Brown-Forman, I can definitely say that it is a quality company. I would love to own this business, but the valuation is an issue. The best hope to make the type of return that I seek is to wait for a market panic and hope that BF’s price reverts back to normal levels. Given this reality, I am curious if any of the other quality companies in my pipeline will prove to be more attractive than Brown-Forman.
Lately I have been wanting to analyze quality companies so that when they become cheap during the market sell off, I can make a quick buy decision. Railroads were at the top of my list of a business that I wanted to do a deep dive on. I decided to analyze the financials of Union Pacific Railroad (UNP) because they are the largest railroad in the US.
There are several reasons why I’m interested in railroads. First, they’ve been around for 200 years, so they haven’t gone obsolete yet. Railroads enjoy network effects and barriers to entry. It would be nearly impossible to build all new rail lines. Locomotives are also the most efficient way to transport goods across land. Because of these factors, I believe railroads have one of the strongest moats out there.
Qualitative factors aren’t the only reasons to invest in a company, you need to take a look at their financials. When something jumps out at me in UNPs financials, I tried to dig deeper to find an explanation. I documented my train of thought in this post, basically asking questions and trying to draw conclusions. Also, I tried to include a good amount of charts to help visualize trends in the financial statements. In the end, I feel like I have a much clearer understanding of Union Pacific’s business.
Why is FCF CAGR Higher Than Revenue?
One of the first things I take a look at when analyzing a company is the growth rate of revenue, operating income, operating cash flow, FCF, etc. The chart below shows UNP’s 10 year revenue, cash flow from operations, and free cash flow. Over the past ten years, revenue has grown at a CAGR of 1.6%. Revenue grew at a steady pace from 2010 to 2014. At first I wondered if it was due to bouncing back from the 2008 recession. However, revenue was $18B in 2008, fell to $13.3B in 2009, then was back to $17B in 2010.
The revenue growth is probably due to the shale energy boom that was going on back then. A decent chunk of Union Pacific’s revenues comes from transporting frac sand, and the resulting crude, natural gas, and finished products. When oil prices plummeted in 2015, domestic oil production was curtailed. The shale oil bust helps explain UNP’s decline in revenues since 2014.
Despite the low revenue growth, operating cash flow has grown by 3.8% and FCF has grown by 7.9%. The fact that these cash flows have outpaced revenue growth warrants some more investigation. Over a long time horizon, it doesn’t make economic sense that profits would grow faster than the revenue the business is bringing in. Union Pacific’s growth of cash flow from operations can be explained by the improvement of the operating ratio, which I will touch on in a bit.
Since the free cash flow is the operating cash flow, minus capex, it will grow in tandem with the operating cash flow. Additionally, since the free cash flow has outpaced operating cash flow, this implies that capex has proportionally decreased over the course of the past ten years. Looking at the cash flow statement, capex has been about flat for the past 5 years.
Operating Ratio
One of the key metrics used to judge the performance of a railroad is its operating ratio. The operating ratio is simply the operating expenses divided by the revenue. A lower ratio implies the railroad is more efficient, so it’s a never ending quest to lower the ratio.
The chart below shows the operating ratio from 2006-2020. The 80% operating ratio in 2006 seems pretty inefficient compared to the 60% of recent years. This large improvement in efficiency is a large factor of how Union Pacific’s cash flow from operations has grown so fast. Revenue has grown at a mediocre rate, but expenses have dramatically fallen.
Honing in on the next chart, we see individually UNP’s revenue and expenses. Something I noticed was that revenue started growing faster than expenses around 2009 until 2014. Since then revenue and expenses have more or less moved in tandem.
As someone who is potentially interested in owning railroads, I would hope that the operating ratio continues to decline. Union Pacific has declared that their goal is to reach an unheard of 55% ratio. This is a worthy goal, and there are probably efficiencies to be gained from automation and technology. UNP began the Precision Railroading concept in 2018, which should continue to reduce expenses. However, an investor should be cognizant of the possibility that there are diminishing returns in efficiency, or operating income deteriorates somehow (wages, fuel prices increase, more capex?). As an amateur railroad analyst, I have no idea how likely it would be that expenses increase. A stagnant, or increasing operating ratio would impact other areas of UNP’s business, which I will touch on later.
Return on Equity
Here I want to briefly look at UNP’s return on equity. In the chart you can see that ROE steadily went from around 10% in 2006 to about 20% in 2016. Then in 2017, Union Pacific’s ROE spiked to 43%, then fell closer to 30% the past couple of years. These large jumps are due to the railroads change in equity due to a large increase in net income in 2017. The large net income increase was due to the tax cuts. UNP paid about $3 billion in taxes for 2016, but was refunded about $3 billion in 2017. In general, UNP’s upward trend in ROE is from increasing net income, as well as decreasing shareholder equity (which I’ll touch on in a minute).
Why Has D/E Increased Lately?
A company’s debt-to-equity ratio is one of the key metrics I look at to gauge the strength of the balance sheet. Typically I would want a company to have a D/E below 1.0, unless they have very stable earnings. A high debt-to-equity value means the business has a large debt burden, which could mortally wound them during a rough patch in the economy. Seeing the spike in the D/E for UNP required me to dig in further.
UNP Debt
From 2005 to 2014, UNP’s D/E has been around a safe 0.5. More recently, the debt-to-equity ratio has ramped up, ending 2020 at 1.5. These values are fairly high, and the sharp trend upward is a bit concerning. Starting in 2012, UNP has been ramping up debt issuance. Over the last 5 years, they have issued an average of $2.8 billion in debt per year.
UNP Equity
On the equity side, we have seen earlier that shareholders equity has steadily decreased. When the denominator (debt) is increasing and the numerator (equity) is decreasing, it makes sense that the D/E has tripled. Digging into the equity a little more, the two key line items are retained earnings and treasury stock. Retained earnings are steadily increasing, going from $17.15B in 2010 to $51.3B in 2020. This is good because it means the company is consistently profitable.
Treasury stock is the placeholder value for the cumulative dollar amount of share the company has bought back. These share buybacks are considered negative equity, so they count against the shareholder equity value. Treasury stock has gone from -$4B in 2010, to -$40.4B in 2020. The growth in treasury stock, aka their share buybacks, is what is greatly decreasing Union Pacific’s equity. So the key takeaway here is the UNP is increasing debt, while also reducing their equity through share buybacks. This is causing the dramatic rise in D/E. The reduction in equity also explains the recent elevated ROE.
Shareholder Return
As we saw by analyzing the ROE and D/E, UNP is reducing their equity through share buybacks. This is usually beneficial to shareholders, so we can calculate shareholder return. Shareholder return is calculated by adding the dividends paid and the dollar amount of share buybacks. You can then convert this to a per share basis, and figure out your yield based on the price paid for the stock.
These values can be found on the cash flow statement. Here we find that in 2020, UNP paid out $2.63B in dividends while spending $3.71B buying back shares, for a total shareholder return of $6.34B. As a note in 2020 UNP reduced their buybacks by about $1B compared to the previous year. On a per share basis, shareholder return was $9.34 a share. Looking at the past 5 years, we can round a bit and say that UNP has spent $2B in dividends and $5B in buying back shares.
Analyzing the cash flow statement further, we can see that the 2020 free-cash flow per share is $8.26. This is an interesting observation because it means UNP is returning more cash to shareholders, than what the operating business is generating. How is this done? UNP is able to do this by constantly issuing debt. Luckily this is cheap debt. However it would seem reasonable that UNP can not return more cash to shareholders than the business produces forever.
Debt Limits
How long can Union Pacific continue to reward shareholders by issuing debt? Well that is tough to answer, but probably comes down to the risk tolerance of management and the shareholders, UNP’s debt covenants, interest rate levels, and the company’s earnings power. As I mentioned earlier, typically I prefer a D/E ratio below 1.0, however the management may feel comfortable at a higher level since interest rates are low. If that is the case, I would have to decide if I think the stock could weather a recession with that debt load.
I did a little digging into Union Pacific’s debt covenants. At one point in their 10-K, UNP mentions they can not surpass a Debt/EBITDA ratio of 3.5. In their most recent earnings presentation, UNP stated their Debt/EBITDA ratio increased from 2.5 in 2019 to 2.9 in 2020. I’m not sure what a reasonable Debt/EBITDA ratio is for a railroad, but it seems 3.5 is getting into the danger zone. We already observed that debt has been increasing at about $3-5B a year. On the EBITDA side, it has not really increased in the last several years. If this trend continues, then it seems reasonable that UNP will hit their Debt/EBITDA limit of 3.5 within the next few years.
Union Pacific’s Future Shareholder Return
Going forward, it looks like Union Pacific has to increase their earning power to keep the share buyback train going, or eventually slow down the debt issuance and pay down their current debts. The increasing earnings power plan could be a realistic outcome. That is where our friend the operating ratio comes back into play. If UNP can go from an operating ratio of 60% down to 55%, that will provide more EBITDA to keep them under their debt covenant. My naive guess is that there are plenty of efficiency gains to be had from technology and automation. The spoiler would be if expenses increased for some reason, such as fuel cost or labor cost.
If Union Pacific’s earnings power does not materially increase, then eventually they will hit a point where they need to deleverage. The least painful scenario would be to not increase share buybacks/shareholder return every year. Then as earnings grow, the excess can be used to pay down the debt. The more painful situation would be UNP reducing its shareholder return in order to reduce its debt level. If investors are used to getting a relatively high return through dividends and buybacks, they will most likely react negatively if those are dialed back.
What Management is Saying
In Union Pacific’s Q3 earnings call, the management indicated they wanted to reduce debt by $800M in Q4 2020. Looking at their Q4 cash flow statement, $1.22B of debt was paid down in the fourth quarter. Management mentioned in their Q4 earnings call that they would dial back up their share buy backs in 2021 since they let their foot off the gas in 2020. It seems to me like there is some mixed messaging from the management about recently wanting to pay down debt, while at the same time wanting to ramp up buybacks in 2021.
Wrapping Things Up
After digging into Union Pacific’s financials, it leaves me a bit torn. Qualitatively, UNP is a strong company with a wide moat. Railroads provide efficient transportation, and it is nearly impossible to build competing networks. However, to me it seems like this quality operating business is wrapped in a layer of financial engineering. UNP is able to take out cheap debt, then pay more in dividends and buybacks than the cash the business generates. This seems to be a common occurrence with blue-chip companies in this era of cheap debt.
This strategy has worked out very well for the last 5+ years. I wish I would have bought some stock back then. I am worried that the party has to end eventually. Maybe UNP has a few years ahead before they have to reel back the debt. In the meantime, the stock price could continue to perform very well. However, if you’re looking to buy UNP and hold indefinitely, you may have to endure a little rough patch whenever they deleverage. I wanted to believe in Union Pacific, but I think I’ll watch on the sidelines for a bit to see how things play out.